Geographic Distribution and Determinants of Postnatal Care Utilization In Ethiopia: Spatial and A Multilevel Analysis of the Recent Demographic and Health Survey
Abstract
Introduction:
Maternal and child health problems are very diverse and arises from maternal
services like postnatal care. However, the low postnatal care being reported in
middle and low-income countries are from the multiple factors, which change
over geographic space and time and need timely assessments. Therefore, the
current study was aimed to assess the prevalence, spatial variations and its
associated factors from country representative data.
Methods: A
secondary data analysis was conducted on the data from EMDHS 2019 on the 2,158
mothers with birth record in last 2 years. Global Moran’s I statistics and
Getis Ord Gi* statistics tools were used to visualize the spatial pattern and
identify hotspot/cold spot areas, respectively. Kulldorff SaTScan was used to
detect purely significant spatial clusters. A multilevel binary logistic
regression applied to examine the relationship between postnatal care and its
determinants. Variables included into the model at p-value of <0.25.
Descriptive statistics was presented using mean, numbers, standard deviation
and proportion while, inferential statistics presented using AOR with 95% CI
where association was declared at p-value of <0.05.
Results: From
the analysis, the postnatal coverage from EMDHS 2019 was 11.91% (95% CI:
10.54%, 13.28%). There was significant geographical variation within the
country; high regional prevalence of postnatal care utilization was detected in
Tigray, Central Amhara and Oromia and Northern part of SNNP regions. Whereas,
low prevalence was observed in Somali and Afar regions. Mothers who had ANC
service for 1-3 times [AOR=4.08; 95% CI: 2.25, 7.43], ANC 4 or more times
[AOR=4.87; 95% CI: 2.62, 9.05] and gave birth through caesarean section
[AOR=1.72; 95% CI: 1.08, 2.73] are factors which had positive association with
postnatal care. Whereas, delivery attended by other non-professional
individuals [AOR=0.29; 95% CI: 0.12, 0.77], mothers who live in Afar 73%
[AOR=0.27; 95% CI: 0.12, 0.64], Somali [AOR=0.33; 95% CI: 0.12, 0.86] and
Benishangul Gumuz regions [AOR=0.42; 95% CI: 0.19, 0.91] were negatively
associated factors with postnatal care service utilization.
Conclusion
and recommendation: According to this analysis, postnatal
care in the country was below the expected level recommended by the WHO.
Although high proportion of uneducated mothers, low antenatal coverage, low
institutional delivery and birth attendance need the major operation, the
association beyond these with number of antenatal cares, delivery attendance
and the pastoralist regions require government and international community
commitments. Regional specific interventions should be launched by the
government and other stakeholders, which is confirmed and supported by local
academic research in regions with low prevalence, to tackle those determinant
factors.
Keywords: Geographic
distribution, postnatal care, determinants, maternal health services, Ethiopia
1. Introduction
The United Nations (UN) Sustainable Development Goals (SDG) planned to reduce maternal mortality rate to 70 per 100,000 live births in 2030. Yet, maternal mortality rate was 152 per 100,000 live births worldwide and it was 533 per 100,000 live births in sub-Saharan Africa (SSA) in 2020. In Ethiopia, the rate was 412 per 100,000 live births in 20201-3.
Similarly, infant and child mortality rates are among the basic indicators used to measure a country’s socioeconomic situation and quality of life. Globally, above one million newborns die every year during the first 24 hours after delivery and almost all of these deaths occur in the developing countries. The neonatal mortality rates were 28 deaths per 1,000 live births in SSA. Similarly, the 2019 Ethiopia Mini Demographic and Health Survey (EMDHS) report revealed that neonatal mortality rate was 30 deaths per 1,000 live births. The majority of causes for maternal mortality (75%) were related to preeclampsia, eclampsia, postpartum infections, prolonged labor and unsafe abortions4-6.
Utilizing maternal health services during pregnancy, labor and delivery and the postpartum period highly prevent the maternal and newborn morbidity and mortality. Postnatal care (PNC) service is one of a fundamental element of the continuum of essential maternal health services given at the time from an hour after delivery of a newborn to 6 consecutive weeks. World Health Organization (WHO) defines PNC as a care given to the mother and her newborn child right after delivery up to 42 days of postpartum periods. Accordingly, WHO recommends a mother and her newborn baby to receive PNC within 24 hours of delivery, on day two to three, in the second to third week and 6 weeks after birth7,8.
The 2019 report of UNICEF showed that PNC service utilization among mothers and newborns within the first 42 days of birth were 63% and 48% respectively9. In fact, the service is the most neglected, least utilized and with high rate of discontinuity among maternal and child survival interventions in the developing countries including Ethiopia. The study conducted in 36 SSA countries by using the most recent DHS data reported that 52.48% of mothers had utilized PNC service10. In Ethiopia, the PNC service coverage was very poor (6.9%), which is illustrated by the findings from secondary data analysis of the 2016 Ethiopian Demographic and Health Survey (EDHS)11.
Previous studies conducted in Ethiopia and other developing countries has identified the predictors of PNC service utilization. The studies revealed maternal age, maternal education, paternal education, wealth quintile, religion, occupation, media exposure, distance to health facility, number of ANC visits, place of delivery, mode of delivery, parity, region and type of place of residence as determinants of PNC service utilization10,12-18.
It is known that the determinants of PNC service utilization vary between populations with different socio-economic and demographic conditions, having different structures of health system, with diverse cultures and various geographical locations. Studies conducted at national level have prominent contributions in designing appropriate policies that help to intervene the gap shown in utilizing PNC service. Using multilevel mixed-effects logistic regression model help to consider variations observed due to clustering effect and to identify both the individual and community level variables, which cannot be handled by traditional logistic regression. Identifying factors that influence PNC service utilization in countries like Ethiopia is much important to overcome the problems and as a result, to reduce morbidity and mortality attributed to poor utilization of maternal health services in general and PNC service in particular.
2. Methods
2.1. Study settings and data source
This analysis used the 2019 Ethiopian Mini Demographic and Health Survey (EMDHS) data. Demographic and Health Survey (DHS) collects a countrywide representative data on basic health indicators in the five years’ time interval. It was used a two-stage stratified sampling technique to select respondents of the survey. The survey included all the 9 regions and the 2 city administrations of Ethiopia. The current study employed Individual Recode (IR) or Kids Recode (KR) file that covers all the collected data in the woman’s questionnaire. All Ethiopian women with a live birth 2 years prior the survey was the source population of the study.
2.2. Measurements of variables
2.2.1. Dependent variable: The response variable for this study was PNC service utilization. It was defined as having at least one visit that was provided by a health professional within 42 days of birth. Thus, the outcome variable was coded as “1” if mother visited at least once after delivery and “0” otherwise.
2.2.2. Independent variables:
2.2.2.1. Individual-level variables: This includes maternal education, maternal age, religion, marital status, wealth index, timing of 1st ANC check, number of ANC visits, place of delivery, mode of delivery, age of mother at 1st birth, birth order number, type of birth, delivery attendants, family size, parity and mentioned at least 3 pregnancy danger signs. Community-level variables were geographic regions where the mothers live and type of place of residence.
2.3.
Data processing and statistical analysis
STATA version 14 was used for data processing and analysis. Sampling weight was applied to manage the representativeness of the survey and to account for sampling design when calculating standard errors. We computed summary statistics for each individual and community-level variables and described the results by using texts, tables and figures. Since DHS data had a hierarchical structure, we used multilevel mixed-effects logistic regression model to analyze the data. This model handles the violation of independent observations and equal variance assumption of the traditional logistic regression model. In this model, we fitted four models to estimate both fixed and random effect of the individual and community-level variables. We used the null model, a model without any independent variable, to check the presence of between-cluster variability. Secondly, we included all individual-level factors in the model (Model I). Additionally, Model II was fitted with only community-level variables. Finally, the combined model (Model III) was done with both the individual and community-level variables to identify factors associated with PNC service utilization (net fixed and random effects). Intra-class correlation coefficient (ICC), Proportional Change in Variance (PCV), Median Odds Ratio (MOR) and deviance were used to compare models and identify best-fitted model. We used Variance Inflation Factor (VIF) to test the existence of multicollinearity between covariates. In this analysis, the mean VIF was 2.49 and this indicates absence of multicollinearity. Variables with p-value <0.25 in the bivariable analysis were considered as candidates for multilevel multivariable analysis. Finally, Adjusted Odds Ratio (AOR) with 95% confidence interval was used to report statistically significant variables with the PNC service utilization.
2.4.
Spatial analysis
The
spatial analysis was carried out using ArcGIS 10.7.1 and SaTScan 9.6. The
weighted frequency of outcome variable was cross tabulated with cluster number
using STATA software and exported to excel to calculate proportion of PNC
service utilization across each cluster. Then the excel file was imported into
Arc-GIS 10.7.1 and joined with geographic coordinates of each cluster using
each EA’s unique identification code for spatial analysis. The units of spatial
analysis were DHS clusters (Since geographic coordinates of EDHS were collected
at cluster level).
The
Global Moran’s-I statistics was used to assess the presence of spatial
autocorrelation to evaluate whether the pattern of outcome variable is
clustered, dispersed or random across the study area. Moran’s I is spatial
statistics produce a single output value which ranges from -1 to +1. Moran’s, I
value close to −1 indicates the pattern is dispersed, whereas Moron’s I close
to +1 indicates clustered and distributed randomly if it is zero. A
statistically significant Moran’s I with p-value < 0.05, leads to rejection
of the null hypothesis (PNC service utilization is randomly distributed across
the clusters) and indicates the presence of spatial autocorrelation which needs
further local analysis.
The
Getis-Ord Gi* statistic was used to identify local clusters of high values
(hotspots) and cluster of low values (cold spots). Getis-Ord Gi* statistics
calculates Gi* statistic, Z-score and p-value, with Z-score and p-value
determines the significance of spatial clustering. If z-score is higher, the
intensity of the clustering is stronger whereas Z-score near zero indicates no
apparent clustering. A positive z-score indicates clustering of high values and
a negative z-score indicates clustering of low values. Spatial interpolation
analysis was done using Ordinary Kriging interpolation technique to estimate
PNC service utilization in un-sampled areas based on sampled values.
Spatial
scan statistical analysis of Bernoulli based model was employed to test for the
presence of statistically significant purely spatial clusters of PNC service
utilization using Kuldorff’s SaTScan version 9.6. It uses a circular scanning
window that moves across the study area. Mothers who had used PNC service were
taken as cases and those who had not as controls to fit the Bernoulli model.
The numbers of cases in each location had Bernoulli distribution and the model
required data for cases, controls, population and geographic coordinates. For
each potential cluster, a log likelihood ratio test statistic and p-value were
computed to determine whether the number of observed cases within the potential
cluster was significantly higher than expected or not. The scanning window with
maximum log likelihood was the most likely performing cluster and p-value was
assigned to each cluster using Monte Carlo hypothesis testing.
3.
Ethical Considerations
The
study used a publicly available secondary data of demographic and health survey
data. Initially, we requested the MEASURE DHS team to access the datasets by
completing the online request form on their website (www.dhsprogram.com).
Consequently, permission to access the data and the letter of authorization was
granted from ICF international. Therefore, for this study consent to
participate is not applicable.
4.
Result
4.1.
Sociodemographic characteristics of mothers
The
present study included 2,158 mothers with a live birth in the 2 years preceding
the 2019 EMDHS. Out of these mothers, almost half (49.07%) had no education,
one-third were in the age range of 15-24 and half (49.54) were Muslims. Majority
of the respondents (94.53) were married and nearly half (48.29%) were from
low-income households. Only a quarter (24.51%) of the total women included in
the survey live in urban areas of the country and 120 (5.56%) mothers were from
Addis Ababa city administration (Table 1).
Table
1:
Sociodemographic characteristics of mothers with a live birth in the 2 years
preceding the EMDHS, 2019.
|
Variables |
Frequency
(n) |
Percentage
(%) |
|
Maternal
education level |
||
|
No
education |
1,059 |
49.07 |
|
Primary
|
755 |
34.99 |
|
Secondary
and above |
344 |
15.94 |
|
Maternal
age |
||
|
15-24 |
705 |
32.67 |
|
25-34 |
1,108 |
51.34 |
|
35-49 |
345 |
15.99 |
|
Religion
|
||
|
Orthodox
|
651 |
30.17 |
|
Protestant
|
396 |
18.35 |
|
Muslim
|
1,069 |
49.54 |
|
Others
|
42 |
1.95 |
|
Married/living
with partner |
||
|
No |
118 |
5.47 |
|
Yes |
2,040 |
94.53 |
|
Wealth
index |
||
|
Poor |
1,042 |
48.29 |
|
Middle
|
302 |
13.99 |
|
Rich |
814 |
37.72 |
|
Region
|
||
|
Tigray
|
185 |
8.57 |
|
Afar |
237 |
10.98 |
|
Amhara
|
208 |
9.64 |
|
Oromia
|
266 |
12.33 |
|
Somali
|
210 |
9.73 |
|
Benshangul
Gumuz |
191 |
8.85 |
|
SNNPR |
239 |
11.08 |
|
Gambella
|
172 |
7.97 |
|
Harari
|
164 |
7.6 |
|
Addis
Ababa |
120 |
5.56 |
|
Dire
Dawa |
166 |
7.69 |
|
Place
of residence |
||
|
Urban |
529 |
24.51 |
|
Rural |
1,629 |
75.49 |
NB: SNNPR:
South Nations Nationalities and Peoples Region
4.2.
Reproductive and obstetric characteristics of mothers
Less
than one-third of the mothers (30.95%) received their first ANC service in the
first trimester of the current pregnancy. On the contrary, more than a quarter
of the total participants (26.51%) did not get ANC service at all. In this
study, mothers who gave birth at health institution were a bit higher than a
half (54.26%) and out of these women, less than one-tenth (7.09%) delivered
through caesarean section. More than one-third women (38.88%) gave their first
birth before the age of 18. Majority of the mothers (98.7%) gave single birth
and delivery attendants for nearly one-third mothers (30.46%) were traditional
birth attendants. Furthermore, four in ten mothers (41.61%) were grand
multiparous (Table 2).
Table 2: Distribution of reproductive and obstetric characteristics of mothers of children less than 24 months old in Ethiopia, 2019.
|
Variables |
Frequency
(n) |
Percentage
(%) |
|
Time
for first ANC visit |
||
|
1st
trimester |
668 |
30.95 |
|
2nd
trimester |
810 |
37.53 |
|
3rd
trimester |
680 |
31.51 |
|
Number
of ANC visit |
||
|
None |
572 |
26.51 |
|
3-Jan |
696 |
32.25 |
|
4 and
above |
890 |
41.24 |
|
Place
of delivery |
||
|
Home |
987 |
45.74 |
|
Health
institution |
1,171 |
54.26 |
|
Mode
of delivery |
||
|
Spontaneous
vaginal delivery |
2,005 |
92.91 |
|
Caesarean
section |
153 |
7.09 |
|
Age of
mother at first birth |
||
|
<
18 |
839 |
38.88 |
|
18-24 |
1,133 |
52.5 |
|
>24
|
186 |
8.62 |
|
Birth
order number |
||
|
1st
born |
498 |
23.08 |
|
2nd –
4th |
1,013 |
46.94 |
|
5th
and above |
647 |
29.98 |
|
Type
of birth |
||
|
Single
|
2,130 |
98.7 |
|
Multiple
|
28 |
1.3 |
|
Delivery
attendants |
||
|
Health
professionals |
1,204 |
55.82 |
|
Traditional
birth attendants |
657 |
30.46 |
|
Others
|
296 |
13.72 |
|
Number
of household members |
||
|
4-Jan |
699 |
32.39 |
|
7-May |
987 |
45.74 |
|
8 and
above |
472 |
21.87 |
|
Parity
|
||
|
Primiparous
|
498 |
23.08 |
|
Multiparous
|
762 |
35.31 |
|
Grand
multiparous |
898 |
41.61 |
|
Mentioned
at least 3 pregnancy danger signs |
||
|
No |
486 |
22.52 |
|
Yes |
1,672 |
77.48 |
4.3.
Coverage of postnatal care service utilization in Ethiopian
The coverage of postnatal care service utilization in Ethiopia was 11.91% (95% CI: 10.54%, 13.28%) (Figure 1). The coverage was better in the urban areas (15.88%) than the rural areas of the country (10.62%). There was also great discrepancy among the regions; it was 21.67% in the Addis Ababa city administration and 3.81% in the Somali region of Ethiopia (Figure 2).
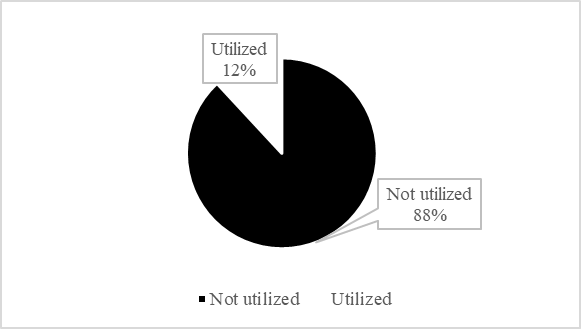
Figure 1: Coverage of postnatal care service utilization among Ethiopian mothers who gave birth in the last 24 months preceding the 2019 EMDHS.

Figure 2: Coverage of postnatal care service utilization among the different regions of Ethiopia, 2019
4.4.
Geographic distribution of PNC service utilization
4.4.1.
Spatial autocorrelation (Global Moran’s I) analysis result: The
spatial distribution of PNC service utilization found to be non-random with a
global Moran’s I statistic value of (I=0.55, P-value <0.01) (Figure 3).
Given the z-score of 4.37, there is less than 1% likelihood that the clustered
pattern could be the result of random chance. Therefore, the null hypothesis
was rejected, which was stated that PNC utilization is distributed randomly.
It, told us the presence of local cluster of PNC service utilization, which
needs to be further explained using local statistics. The incremental
autocorrelation was determined using the average distance band from neighbor
count. The Maximum peak was occurred at (1.96 meter) distance, statistically
significant z-scores revealed that spatial factors encouraging clustering are
most evident and incremental spatial autocorrelation shows that ten distance
bands were detected (Figure 4).

Figure 3: Spatial autocorrelation of postnatal care service utilization among Ethiopian mothers who gave birth in the last 24 months preceding the 2019 EMDHS.

Figure 4: Incremental autocorrelation analysis of postnatal care service utilization among Ethiopian mothers who gave birth in the last 24 months preceding the 2019 EMDHS.
4.5. Hot spot and cold spot (Getis Ord Gi*) analysis result
The Getis-Ord Gi* statistical analysis result indicated that the geographic distribution of PNC service utilization was clustered in some parts of the country. Significant hotspot (high prevalence) of PNC was detected in Tigray, Amhara, Central Oromia and Northern part of SNNP regions. Whereas, statistically significant cold spots (low prevalence) were found in Dire Dawa, Harari, South Afar and Northern part of Somali regions of Ethiopia with 90%-99% confidence levels (Figure 5).

Figure
5:
Hotspot and cold spot analysis report of postnatal care service utilization
among Ethiopian mothers who gave birth in the last 24 months preceding the 2019
EMDHS.
4.6.
Spatial interpolation (Ordinary Kringing) analysis result
Geo-statistical Ordinary Kriging analysis predicted that the highest frequency of PNC service utilization in Central Oromia, North and Central Amhara regions. In contrast, area with relatively lowest frequency was detected in most part of Benshangul Gumuz, Somali, Afar and Gambella regions (Figure 6).

Figure
6:
Spatial interpolation analysis report of postnatal care service utilization
among Ethiopian mothers who gave birth in the last 24 months preceding the 2019
EMDHS.
4.7.
Spatial SaTScan (Culldorff’s SaTScan) analysis result
Purely spatial analysis was conducted with Culldorff spatial saTScan analysis to detect primary spatial clusters of PNC utilization. Primary and secondary clusters of PNC utilization were identified. A total of 5 significant clusters were identified, of which, 1 was most likely (primary) cluster and 4 were secondary clusters. The primary clusters spatial window was detected in Somali region and around Oromia-Somali borders, located at 5.479641 N, 42.196835 E of geographic location with 414.10 km radius and with maximum Log-Likelihood ratio (LLR) of 15.49 (Table 3). It stated that women within this spatial window had 0.21 times more likely to use PNC service than those outside this area of the spatial window (Figure 7).
Table
3:
SaTScan report on significant clusters of postnatal care service utilization
among Ethiopian mothers who gave birth in the last 24 months preceding the 2019
EMDHS.
|
Type of clusters |
No. of locations |
Coordinate/radius |
Population |
case |
RR |
LLR |
P-value |
|
Primary |
29 |
(5.479641 N, 42.196835 E) / 414.10
km |
254 |
7 |
0.21 |
15.487481 |
0.00015 |
|
Secondary |
14 |
(8.995815 N, 38.793907 E) / 8.02 km |
63 |
23 |
3.27 |
13.223402 |
0.0011 |
|
Secondary |
20 |
(10.419190 N, 39.928658 E) / 159.16
km |
146 |
2 |
0.11 |
12.498837 |
0.0022 |
|
Secondary |
9 |
(7.595318 N, 42.898767 E) / 160.96
km |
86 |
0 |
0 |
11.143412 |
0.011 |
|
Secondary |
1 |
(7.596968 N, 38.357304 E) / 0 km |
12 |
8 |
5.75 |
9.988537 |
0.020 |

Figure
7:
Spatial SaTScan analysis of postnatal care service utilization among Ethiopian
mothers who gave birth in the last 24 months preceding the 2019 EMDHS.
4.8.
Factors associated with PNC utilization
In
the multilevel multivariable mixed-effects logistic regression analysis, number
of ANC visits, mode of delivery, delivery attendants and geographic regions
were identified as statistically significant variables with PNC service
utilization among mothers who gave birth in the last 2 years prior the 2019
mini survey. Accordingly, mothers who had received ANC service for 1-3 times
and 4 and more times were 4 [AOR=4.08; 95% CI: 2.25, 7.43] and 4.9 [AOR=4.87;
95% CI: 2.62, 9.05] times more likely to utilize PNC service than mothers who
had no ANC visit. Likewise, mothers who gave birth through caesarean section
were 1.7 [AOR=1.72; 95% CI: 1.08, 2.73] times more likely to utilize PNC
service as compared to those mothers who gave birth through spontaneous vaginal
delivery. Additionally, mother whose delivery attendant was other unskilled
individual were 71% [AOR=0.29; 95% CI: 0.12, 0.77] less likely to utilize PNC
service than mother whose delivery attendant was health professional. Moreover,
from the community-level factors, region where the mother resides was found to
be a significant predictor of PNC service utilization. The odds of PNC service
utilization among mothers who live in Afar, Somali and Benshangul Gumuz regions
respectively were 73% [AOR=0.27; 95% CI: 0.12, 0.64], 67% [AOR=0.33; 95% CI:
0.12, 0.86] and 58% [AOR=0.42; 95% CI: 0.19, 0.91] lower than mothers who live
in the Tigray region of Ethiopia (Table 4).
Table 4: Multilevel multivariable logistic regression analysis result of postnatal care service utilization in Ethiopia, 2019.
|
Variables |
Null model |
Mode1 I AOR (95% CI) |
Mode1 II AOR (95% CI) |
Mode1 II AOR (95% CI) |
|
Maternal education level |
- |
|
- |
|
|
No education |
- |
1 |
- |
1 |
|
Primary |
- |
1.31 (0.93, 1.83) |
- |
1.23 (0.87, 1.73) |
|
Secondary and above |
- |
1.33 (0.86, 2.04) |
- |
1.16 (0.74, 1.82) |
|
Number of ANC visit |
- |
|
- |
|
|
None |
- |
1 |
- |
1 |
|
1 to 3 |
- |
4.49 (2.48, 8.11) *** |
- |
4.08 (2.25, 7.43) *** |
|
4 and above |
- |
5.46 (2.97, 10.03) *** |
- |
4.87 (2.62, 9.05) *** |
|
Place of delivery |
- |
|
- |
|
|
Home |
- |
1 |
- |
1 |
|
Health institution |
- |
0.57 (0.25, 1.31) |
- |
0.52 (0.23, 1.19) |
|
Mode of delivery |
- |
|
- |
|
|
Spontaneous vaginal delivery |
- |
1 |
- |
1 |
|
Caesarean section |
- |
1.80 (1.14, 2.86) * |
- |
1.72 (1.08, 2.73) * |
|
Delivery attendants |
- |
|
- |
|
|
Health professionals |
- |
1 |
- |
1 |
|
Traditional birth attendants |
- |
0.68 (0.29, 1.59) |
- |
0.72 (0.31, 1.68) |
|
Others |
- |
0.33 (0.13, 0.86) * |
- |
0.29 (0.12, 0.77) * |
|
Mentioned at least 3 pregnancy danger signs |
- |
- |
- |
|
|
No |
- |
1 |
- |
1 |
|
Yes |
- |
0.74 (0.54, 1.02) |
- |
0.75 (0.55, 1.02) |
|
Region |
- |
- |
- |
|
|
Tigray |
- |
- |
1 |
1 |
|
Afar |
- |
- |
0.22 (0.09, 0.50) *** |
0.27 (0.12, 0.64) ** |
|
Amhara |
- |
- |
0.65 (0.32, 1.30) |
0.67 (0.34, 1.34) |
|
Oromia |
- |
- |
0.49 (0.24, 0.98) |
0.57 (0.28, 1.13) |
|
Somali |
- |
- |
0.16 (0.06, 0.41) *** |
0.33 (0.12, 0.86) * |
|
Benshangul Gumuz |
- |
- |
0.38 (0.17, 0.84) * |
0.42 (0.19, 0.91) * |
|
SNNPR |
- |
- |
0.65 (0.33, 1.29) |
0.85 (0.43, 1.68) |
|
Gambella |
- |
- |
0.55 (0.25, 1.17) |
0.64 (0.29, 1.36) |
|
Harari |
- |
- |
0.78 (0.37, 1.63) |
0.86 (0.41, 1.78) |
|
Addis Ababa |
- |
- |
0.97 (0.43, 2.21) |
0.90 (0.41, 2.01) |
|
Dire Dawa |
- |
- |
0.82 (0.39, 1.17) |
0.82 (0.40, 1.69) |
|
Place of residence |
- |
- |
|
|
|
Urban |
- |
- |
1 |
1 |
|
Rural |
- |
- |
0.76 (0.49, 1.17) |
1.03 (0.66, 1.62) |
4.9.
Random effect analysis result
The result of random effect estimates obtained after fitting the four models (Null model, Model I, Model II and Model III) were depicted in the Table 4. The presence of likelihood of PNC service utilization variation within the 9 regions and 2 city administration of the country was shown by the ICC of the Null model (ICC=20.2%). This indicates that 20.2% of the variation in PNC service utilization among mothers of children less than 2 years old was attributed to the difference between the regions. Additionally, the highest PCV (49.39%) in the final model (Model III) implies the majority of variations of PNC service utilization among mothers observed in the null model was explained by both individual and community-level factors. Also, the lowest deviance in the last model showed that the model III was the best fitted model (Table 5).
Table
5:
Random effect analysis result.
|
Parameters |
Null model |
Model I |
Model II |
Model III |
|
Community level variance
(SE) |
0.83 |
0.54 |
0.52 |
0.42 |
|
ICC (%) |
20.2 |
14.2 |
13.7 |
11.2 |
|
PCV (%) |
Reference |
34.94 |
37.35 |
49.39 |
|
MOR |
2.36 |
2.01 |
1.97 |
1.86 |
|
Log-likelihood |
-770.93 |
-726.18 |
-750.69 |
-717.09 |
|
Deviance |
1,541.86 |
1,452.36 |
1,501.38 |
1,434.18 |
|
AIC |
1545.86 |
1474.24 |
1527.38 |
1478.19 |
|
BIC |
1557.21 |
1536.68 |
1601.18 |
1603.08 |
5.
Discussion
From
the analysis, the proportion of PNC service utilization in Ethiopia was 11.91%
(95% CI: 10.54%, 13.28%). It is 6.9% from 2016 EDHS11; however, it is contradicting with finding reported the
proportion of 9.7% to 201119. From
small scale studies it is less than 29.7% proportion in Sidama region20 and 28.4% in Northern Shoa21 and 36.8% in the country sample22. This finding is also less than the East
African countries proportion and sub some studies. It is less than 90.4%
proportion in Sierra Leone23 and
52.48% sub-Saharan magnitude10. The
difference indeed worrying as the increase from 2011 to 2016 and 2016 to 2019
were just unconceivable. The coverage decreased from 2011 to 2016 by 3% and
increased from 2016 to 2019 only by around 4%. It is an indication of unstable
and not directed improvement that requires another stair effort. From this
analysis, ANC is only 30.95%. This is less than 44% finding from Ethiopia19, 91.2% finding from the study conducted in
four regions (Oromia, Amhara, SNNP and Tigray)10
and is also less than the 78% finding in Sierra Leone23. The finding was also very small compared to
other small scale and large-scale studies. It is consistent with other maternal
factors in this study, which enquire attention diversion for all fallouts. Such
impression has been since so long and might continue unless those grasses
rooted problems in pastoralists region resolved. The country is in
multifactorial problems when we see 30.46% of births still attended by
traditional birth attendants and home delivery remained at 45.74%. This
situation is not much different from other studies with in the same period showed
another 64.31% and 52.50%24-26 and
traditional birth attendance is remained at 44.08% from another study26.
Overall,
place of delivery, postnatal care, antenatal care and birth attendants’ causes
unprecedented health problem to mother-child in the country and without
interruption if these things go on, the future is very difficult to see any
optimism as per these evidences. Maternal education is always in the equation
although the improvement similarly remained under par where 49.07% of women
were uneducated. It is also supported by loads of evidence in the available
literature20,22,26-29. There many
factors might be causing such problems like number of ANC visits, mode of
delivery, delivery attendants and geographic regions were identified
statistically associated. One-three and four or above ANC clearly influenced up
taking of PNC. This finding is supported by many studies in the country and
region10,25,27-29. The consistent
information might indicate maternal education should always come first to start
from. The fact that caesarean section is the only delivery procedure which
cannot be performed outside health institutions and since it requires highly
trained health professionals, its positive association with increased PNC shows
its importance21,22,28. The
relationship of PNC with the delivery performed by trained health professionals
was also manifested, when it is decreased by 71% if carried out by non-trained
individuals. This is also consistent with other studies in the country which
indicate the time mothers pass with trained health professionals worth
everything19,28. As a big headache
for the pastoralists and semi-pastoralist regions are always riding down from
the improvement.
In
this study compared to the Tigray region, pastoralists regions like Somali and
Afar had a decreased PNC by 73% and 67% respectively followed by 58% decrease
in Benishangul Gumuz which loads of literatures in Ethiopia say the same thing
all around11,22. This may indicate
that missing spicy is focusing these regions to increase national coverage.
Even though this study used the most recent data from DHS national survey, it
has some drawbacks that need consideration during using. Disproportional nature
of sampling, secondary nature data and cluster nature of the data. We, strictly
followed analysis guidelines commonly applied internationally, weighted the
data considering both strata and primary sampling units and applied multilevel
analyses, which considered clustering nature of data.
6.
Conclusion
The
postnatal care service in Ethiopia was very small compared to findings both in
the country and in Sub-Saharan region. Variables like number of ANC visits,
mode of delivery, delivery attendants and geographic regions were identified
statistically associated. One-three and four or above ANC clearly influenced up
taking of PNC and should be consider during the next intervention planning.
Pastoralists regions carry much of the burden posed by the problem and women in
this region might suffer a lot from the problem. Improvement in these regions
might also raise the regional and national coverage and a great deal from the
policy makers. Overall, postnatal care, antenatal care, increasing exposure of
women through institutional delivery and maternal education might deserve
separate intervention that might enquire government commitment and
international community support.
7.
Abbreviation/Acronyms
Ethiopian
Demographic Health Survey (DHS); Ethiopian Mini Demographic Health Survey
(EMDHS); World Health Organization (WHO); United Nation Children’s Fund
(UNICEF);South Nations Nationalities and Peoples Region (SNNPR); Confidence
Interval (CI); Antenatal Care (ANC); Postnatal Care(PNC); Log Likely-hood (LL);
Akaike Information Criterion (AIC); Baye’s Information Criterion (BIC);
log-likelihood(-2LL); Intra-class Correlation Coefficient (ICC), Proportional
Change in Variance (PCV), Median Odds Ratio (MOR)
8.
Declarations
8.1.
Ethics approval and consent to participate
This
study used secondary data from demographic and health survey data files.
Initially, the MEASURE DHS team was formally requested to access the datasets
by completing the online request form on their website (www.dhsprogram.com).
Accordingly, permission to access the data and the letter of authorization was
obtained from ICF international. Therefore, for this study consent to
participate is not applicable. We kept all data confidential and no effort was
made to identify households or individuals. The Ethiopian Health Nutrition and
Research Institute (EHNRI) Review Board and the National Research Ethics Review
Committee (NRERC) at the Ministry of Science and Technology of Ethiopia,
approved EMDHS 2019. The authors also confirm that all methods were carried out
in accordance with relevant guidelines and regulations.
8.2.
Consent for publication
Not
applicable.
8.3.
Availability of data and materials
The
survey dataset used in this analysis is the third-party data from the
demographic and health survey website (www.dhsprogram.com) and permission
to access the data is granted only for registered DHS data user.
8.4.
Competing interests
The
authors have declared that no competing interest existed.
8.5.
Funding
The
authors received no specific funding for this work.
8.6.
Authors’ contribution
GG
has analyzed the EMDHS data while, SS was equally involved in the conception of
the study, interpreted the results, drafted and critically revised the
manuscript and YA was involved in spatial analysis and critically revised the
manuscript. All authors have read and approved the final version of the
manuscript.
8.7.
Acknowledgments
The authors are grateful to Measure DHS, ICF International Rockville, Maryland, USA for allowing us to use the 2019 EDHS data.
9. References
- WHO.
Trends in maternal mortality: 1990 to 2015: estimates by WHO, UNICEF, UNFPA,
World Bank Group and the United Nations Population Division. Geneva,
Switzerland, 2015.
- Foundation.
B& MG. Global Progress and Projections for Maternal Mortality, 2021.
- USAID.GOV/ETHIOPIA.
Ethiopia Fact Sheet: Maternal and Child Health, 2020.
- Ethiopian Public Health
Institute (EPHI) and ICF. 2019. Mini Demographic and Health Survey 2019: key
Indicators. Rockville, Maryland, USA: EPHI and ICF, 2019:35.
- WHO.
Newborns : improving survival and well-being, 2020.
- Alvarez
JL, Gil R, Hernández V, Gil A. Factors associated with maternal mortality in
Sub-Saharan Africa: An ecological study. BMC Public Health, 2009;9: 1-8.
- Warren C, Daly P, Toure L,
Mongi P. Postnatal care. Postnatal care, 2018.
- Stevens GA, Finucane MM,
Paciorek CJ. Levels and Trends in Low Height-for-Age. In: Disease Control
Priorities, Third Edition: Reproductive, Maternal, Newborn and Child Health,
2016;2: 85-93.
- The
United Nations Children’s Fund (UNICEF). UNICEF Annual Report, 2019. UNICEF
Annual Report 2019, 2020.
- Tessema ZT, Yazachew L, Tesema GA. Determinants
of postnatal care utilization in sub-Saharan Africa : a meta and multilevel
analysis of data from 36 sub- Saharan countries. Ital J Pediatr, 2020;46: 1-11.
- Sisay MM, Geremew TT, Demlie
YW, et al. Spatial patterns and determinants of postnatal care use in Ethiopia:
Findings from the 2016 demographic and health survey. BMJ Open, 2019;9: 1-9.
- Tiruneh
GT, Worku A, Berhane Y, Betemariam W, Demissie M. Determinants of postnatal
care utilization in Ethiopia : a multilevel analysis, 2020;7: 1-12.
- Limenih MA, Endale ZM, Dachew BA. Postnatal
Care Service Utilization and Associated Factors among Women Who Gave Birth in
the Last 12 Months prior to the Study in Debre Markos Town , Northwestern
Ethiopia : A Community-Based Cross-Sectional Study. Int J Reprod Med,
2016;2016.
- Tadele A, Tadele A,
Getinet M. Determinants of Postnatal Care Check-ups in Ethiopia : A Multi-
Level Analysis. Ethiop J Heal Sci, 2021;31: 753.
- Mekonnen T, Dune T, Perz J, Ogbo FA. Postnatal
Care Service Utilisation in Ethiopia : Reflecting on 20 Years of Demographic
and Health Survey Data. Int J Environ Res Public Heal, 2021;18: 193.
- Sagawa J, Kabagenyi A, Turyasingura G,
Mwale SE. Determinants of postnatal care service utilization among
mothers of Mangochi district , Malawi : a community-based cross- sectional
study. BMC Pregnancy Childbirth, 2021;4: 1-11.
- Ahinkorah
BO, Seidu A, Budu E. Factors Associated with Utilization of Postnatal Care
Services in Mali , West Africa. Int J Transl Med Res Public Heal, 2021;5:
23-32.
- Somefun
OD, Ibisomi L. Determinants of postnatal care non ‑ utilization among women in
Nigeria. BMC Res Notes, 2016;9: 1-11.
- Tarekegn
SM, Lieberman LS, Giedraitis V. Determinants of maternal health service
utilization in Ethiopia: Analysis of the 2011 Ethiopian Demographic and Health
Survey. BMC Pregnancy Childbirth, 2014;14: 1-13.
- Yoseph S, Dache A,
Dona A. Prevalence of Early Postnatal-Care Service Utilization and Its
Associated Factors among Mothers in Hawassa Zuria District, Sidama Regional
State, Ethiopia: A Cross-Sectional Study. Obstet Gynecol Int, 2021;2021.
- Akibu M, Tsegaye W, Megersa T,
Nurgi S. Prevalence and Determinants of Complete Postnatal Care Service
Utilization in Northern Shoa, Ethiopia. J Pregnancy, 2018;2018.
- Tadele A, Getinet M.
Determinants of Postnatal Care Check-ups in Ethiopia: A Multi-Level Analysis.
Ethiop J Health Sci, 2021;31: 753-760.
- Sserwanja
Q, Nuwabaine L, Kamara K, Musaba MW. Prevalence and factors associated with
utilisation of postnatal care in Sierra Leone: a 2019 national survey. BMC
Public Health, 2022;22: 1-10.
- Id
SH, Gilano G, Simegn AE, Tariku B, Id S. Spatial variation and determinant of
home delivery in Ethiopia : Spatial and mixed effect multilevel analysis based
on the Ethiopian mini demographic and health survey 2019, 2022: 1-16.
- Adane B, Fisseha G, Walle G,
Yalew M. Factors associated with postnatal care utilization among postpartum
women in Ethiopia: A multi-level analysis of the 2016 Ethiopia demographic and
health survey. Arch Public Heal, 2020;78: 1-10.
- Raru TB, Ayana GM, Yuya M, Merga BT, Kure MA,
Negash B, et al. Magnitude, Trends and Determinants of
Institutional Delivery Among Reproductive Age Women in Kersa Health and
Demographic Surveillance System Site, Eastern Ethiopia: A Multilevel Analysis.
Front Glob Women’s Heal, 2022;3: 1-10.
- Berelie
Y, Tesfa E, Bayko T. Utilization of Postnatal Care Services after home delivery
in Ethiopia: A Multilevel Logistic Regression Analysis. African J Med Heal Sci,
2019;18: 1-9.
- Senait
B, , Sr Yeshi A, Berhanu WG. Prevalence of Postnatal Care Utilization and
Associated Factors among Women Who Gave Birth and Attending Immunization Clinic
in Selected Government Health Centers in Addis Ababa ,Ethiopia, 2016. J Heal
Med Nurs, 2016;26: 94-108.
- Ayele BG, Woldu MA, Gebrehiwot HW, Gebre-Egziabher EG, Gebretnsae H, Hadgu T, et al. Magnitude and determinants for place of postnatal care utilization among mothers who delivered at home in Ethiopia: A multinomial analysis from the 2016 Ethiopian demographic health survey. Reprod Health, 2019;16: 1-10.