Pseudohyperphosphatemia in a Patient with Multiple Myeloma, Measurement Dependent Interference
Abstract
Background: pseudohyperphosphatemia in patients with multiple myeloma is described in literature as analytical interference or phosphates binding to monoclonal protein. We suspected pseudohyperphosphatemia in 69 years-old patient with igg kappa type of multiple myeloma (phosphates >3 mmol/l, normal concentrations of creatinine, parathormon and vitamin d). The aim was to prove pseudohyperphosphatemia and to determine its origin.
Methods: inorganic phosphate was measured by routine molybdate method in untreated serum and after deproteination by sulfosalycilic acid. Correlation coefficient of phosphate in untreated serum and monoclonal immunoglobulin concentrations between september 2016 and february 2018 was calculated. The reaction was manually simulated and the detailed record of measurement from the analyzer was scrutinized retrospectively. Total phosphorus concentration was measured by mass spectrometry in untreated and deproteined serum of this patient, as well as in control group of 10 samples.
Results: inorganic phosphate concentrations were 3.38 mmol/l in untreated and 1.17 mmol/l in deproteined serum. Correlation coefficient r2=0.8948 between phosphate and monoclonal immunoglobulin was measured. Formation of turbidity during manual simulation and gradual increase in absorbance in measurement record were observed.
Total phosphorus concentrations were 3.60 mmol/l before and 1.20 mmol/l after deproteination, within 95% confidence interval of control group (3.01-4.12 mmol/l untreated; 0.79-1.28 mmol/l deproteined samples).
Conclusion: noticeable difference in phosphates in untreated and deproteined serum together with the normal results of total phosphorus confirm pseudohyperphosphatemia caused by analytical interference rather than binding to monoclonal protein. Rising numbers of patients with myeloma, shows necessity to check for possible interferences and adopt appropriate measures.
Keywords: pseudohyperphosphatemia; multiple myeloma; interference; phosphate assay; mass spectrometry
1.
Introduction
A 69 year old male suffered from
disturbance of cardiac rhythm. In the course of examination, anemia, high serum
protein and immunoglobulin g levels were discovered. Subjectively, he didn’t
have any medical problems and felt healthy. Sternum bone marrow aspiration
biopsy confirmed 26 % of pathological plasmatic cells. X-ray image of entire
skeleton surprisingly did not show any deposit, only on calva, there were
visible changes assessed only as suspicious brightening. Patient had lower
level of hemoglobin, 101 g/l even after receiving two transfusions of
erythrocyte concentrate one week earlier. His original hemoglobin level was
significantly under 100 g/l. The concentration of total protein was 101 g/l,
concentration of monoclonal immunoglobulin class g was 32.4 g/l. Patient had
normal creatinine level and normal glomerular filtration (estimated as ckd-epi,
1.01 ml∙s-1∙1.73m-2). Calcium
concentration, as well as parathormon were within reference range. There was
surprisingly high concentration of inorganic phosphate, 3.36 mmol/l (ri
0.87-1.45 mmol/l). Patient met criterion for establishing the diagnosis of
multiple myeloma by relatively massive infiltration of marrow by pathological
plasmocytes and by the presence of monoclonal immunoglobulin of high concentration.
The diagnosis was set up as symptomatic igg kappa type monoclonal myeloma, ii
a, iss i. The symptom leading to the starting of the treatment was anemia.
The first course of treatment was
started in september 2016 and ended in march 2017. The concentration of
monoclonal immunoglobulin lowered from 32.4 g/l to 11.0 g/l, which was more
than 50%. Considering that the plato phase was reached, the concentration of
monoclonal immunoglobulin was stable during final three months and did not
lower any further, it was not beneficial to continue in this treatment. The
patient was offered maintenance treatment. This treatment was ended in august
2017 as the illness was not sensitive to it, the concentration of monoclonal
immunoglobulin was slightly increasing and was 20 g/l at the time of
discontinuation of the treatment. Subsequently, the illness was slowly
progressing and in december 2017 the next course of treatment was started. The
last visit and last application of the treatment was in march 2018. During the
last three months of the treatment the concentration of monoclonal
immunoglobulin lowered from 20 g/l to 9.1 g/l. Regrettably, the patient died of
complications related to existing disease in march 2018.
The laboratory results corresponded to
the diagnosis, except from phosphate concentration, which was unusually
increased.
Hyperphosphatemia can be caused by
lowered phosphate excretion during chronic renal insufficiency or acute kidney
failure, hypoparathyroidism or vitamin d intoxication. Other reasons are
increased phosphate intake, increased release from bones (metabolic or
respiratory acidosis, osteolytic metastases) or phosphate release from cells
during tissue ischemia, tumor lysis syndrom or massive infection1.
None of these seemed to be the case, as the patient did not suffer from renal insufficiency, calcium and parathormon levels were within reference range and all of the other laboratory values were common given the hematologic malignity. Therefore spurious increase (pseudohyperphosphatemia) was suspected.
Rare cases of pseudohyperphosphatemia in patients with myeloma are already described in literature and are assigned to either of two possibilities. Firstly, the interference with molybdate uv assay used for the measurement was described2-8 caused by the reaction with monoclonal protein during the measurement leading to increased turbidity of the sample. The other possible cause is the binding of serum phosphate to the monoclonal protein and therefore its increased levels, which, at the same time, does not affect its biologically available amounts in patients serum and presumably does not have any clinical significance2-4,9, even though mandry9 remarks, that the clinical insignificance cannot be globally confirmed. Most of the described cases talk about igg kappa type4,6-8,10-14 less about igg lambda type3,10 or iga type2,12 of multiple myeloma. There is also a description of correlation of phosphate concentration on monoclonal protein concentration6,7,10,14,15. The decrease of pseudohyperphosphatemia/phosphatemia caused by plasmapheresis or chemotherapy was also described in some cases2,10-12,16.
Regardless the suspected cause of
hyperphosphatemia, either different method of measurement or measurement of
protein-depleted serum2-8,13-16 is
recommended to exclude the phenomena, as the interference is dependent on the
method used for phosphate measurement. While it was often proven in
determination with ammonium molybdate3-10,12-16 which
is nowadays the most used method for phosphate determination in practice, no
interference was proven neither with the methods, where the proteins are
separated prior to measurement5,10,13-15,
nor with atomic spectrometry4,5,10.
The aim of this study was to prove
pseudohyperfosphatemia in this patient and to specify its origin by
determination of phosphorus concentration by absolute method, mass
spectrophotometry and comparison of results with phosphorus concentrations
found in serum of healthy control group.
2. Methods
As a routine method for inorganic phosphate measurement, 2-point end
molybdate uv method, phos2 (hoffman-la roche, basel, switzerland; further as
roche)17 was used, on c702 module of cobas 8000 system (roche). Inorganic phosphate forms an ammonium
phosphomolybdate complex with ammonium molybdate in the presence of sulfuric
acid. The concentration of phosphomolybdate formed is directly proportional to
the inorganic phosphate concentration and is measured photometrically, using
main wavelength of 340 nm and subsidiary wavelength of 700 nm17.
As a method for total phosphorus measurement, inductively coupled plasma mass spectrometry (icp-ms) agilent 7500ce (agilent technologies, tokyo, japan) was used. The collision reaction cell was used for suppressing of spectral interferences on the mass 31p. For the quantification purpose and suppressing of matrix effect, the method of standard addition was used. The samples were 100 times diluted by deionized water, and a known amount of p was added before the analysis. For the blank and deproteinated samples, the addition was 0, 500 and 1000 ng of p, for the native sample 0, 1500 and 2500 ng of p. Icp-ms measure a total amount of phosphorus (inorganic phosphates, organic phosphorus bound in phospholipid structures, inorganic phosphorus bound to the proteins).
The deproteination of samples were done by sulfosalycilic acid as was previously used in literature2-4,6,7,14,16. The 20% sulfosalycilic acid was added to serum, usually in 1:10 ratio. In case of high residual protein concentration (more than 10 % of the total protein levels in untreated serum), the 1:5 ratio was used. Then the samples were mixed for one minute on vortex and then centrifuged for 5 min at 2500 rcf. After the deproteination, only inorganic phosphate is still present in the supernatant.
The untreated patient sample was measured by uv method and the measurement was repeated after deproteination. The phosphate concentration in untreated serum and monoclonal protein concentrations were measured 16 times between september 2016 and february 2018 and the correlation coefficient between them was counted.
We also simulated the automatic molybdate uv method manually in our
laboratory by following the protocol described in instructions for use with the
original reagents from the reagent pack, only in volume 10 times higher, to
actually see the process and to compare any potential visible abnormalities
with normal sample behavior.
To determine the origin of the interference in this case, the patient´s samples collected over time were pooled, divided into two aliquots and the second aliquot was deproteined. The concentrations of phosphates before and after the deproteination were measured by cobas 8000 and the concentrations of total phosphorus before and after deproteination were measured by icp-ms. The concentration of phosphorus would be higher than concentrations of phosphates, so simple comparison of the values not be enough to assess the cause of the interference. Because of this, we also measured the phosphorus concentration in 10 samples from healthy control group with the same procedure. We worked on the assumption that in case of interference by increased turbidity the total phosphorus levels measured by icp-ms would not show significant difference between the concentrations measured in a sample from our patient and samples from healthy control, which would not be the case if the pseudohyperphosphatemia was caused by biologically unavailable phosphates bound to monoclonal protein.
3. Results
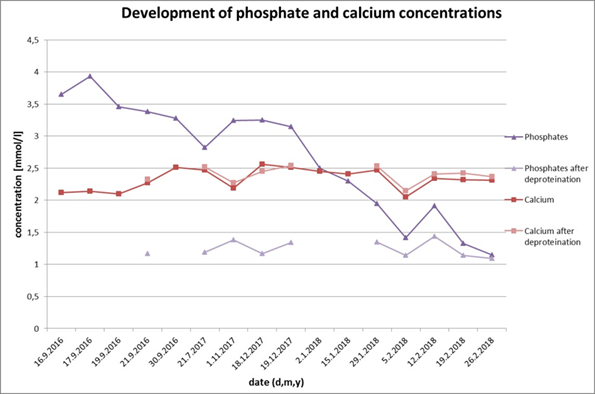
We measured the untreated and deproteined serum of patient with myeloma. While the inorganic phosphate concentration in untreated serumreached 3.38 mmol/l, the value in deproteined serum was 1.17 mmol/l and well within the reference interval (ri 0,87-1,45 mmol/l). We repeated the measurement between september 16 and february 2018 and summarized the results in (figure 1).
Figure 1. The phosphate and calcium concentrations before and after deproteination. While the calcium concentration remains the same after the deproteination, the concentrations of phosphate decrease after the deproteination. There is a significant drop in untreated serum phosphate concentrations during the time caused by treatment of monoclonal gammopathy.
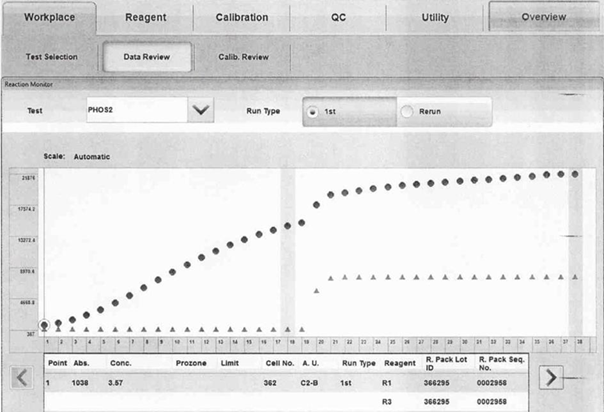
We simulated the automatic process of the colorimetric method in our laboratory manually, by following the instructions for use, modified by multiplying the volumes by 10, to visualize the reaction in reaction tubes. After addition of r1, a very strong turbidity formed in the test tube with our patient sample, contrary to the test tube with healthy control which remained clear. We also scrutinized the measuring record from c702. In the diagram from reaction monitor option, there was a visible rise in absorbance continually increasing during all measurement (figure 2).
Figure 2. Measuring record from c702, dots represent measured absorbance of patient samples in times, triangles represent normal course of measurement, based on quality control. The absorbency of the sample continually increases during the measurement, even before the addition of reagent r2 in time point 17.
To
understand the nature of interference, we measured the phosphates in pooled
serum from the patient with myeloma before and after deproteination by
molybdate uv method. The concentration in untreated pooled serum was 3.13
mmol/l, after the deproteination, the concentration decreased to 1.19 mmol/l.
In the same samples, we measured the concentration of total phosphorus before
and after deproteination by icp-ms. The concentration of phosphorus in
untreated pooled serum was 3.6 mmol/l, after deproteination it lowered to 1.2
mmol/l. There were no significant differences in concentration of phosphate and
total phosphorus in deproteined pooled serum.
As
reference interval of total phosphorus in serum is not well defined, we
determined phosphate and phosphorus concentrations in 10 samples from healthy
control, in untreated and deproteined sera. The phosphorus concentrations
varied between 3.00 and 4.49 mmol/l, with the mean of 3.50 mmol/l (95% ci
3.16-3.84 mmol/l) and median of 3.40 mmol/l (95% ci 3.01-4.12 mmol/l). The
measured concentration of phosphorus of our patient (3.60 mmol/l) lies within
these concentrations. Phosphorus concentrations in deproteined sera varied
between 0.6 mmol/l and 1.32 mmol/l, with the mean of 1.01 (95% ci 0.85-1.17)
mmol/l and median of 1.01 (95% ci 0.787-1.276) mmol/l.
3. Discussion
The
significant difference between the phosphate concentrations measured in
untreated and deproteined serum (3.38 and 1.17 mmol/l, respectively) from
patient with myeloma confirmed the assumption of spuriously increased
concentrations of inorganic phosphates, which lowered during the time as a
result of the treatment of monoclonal gammopathy (figure 1). The spuriously increased phosphate concentrations showed
positive linear correlation to the monoclonal protein concentrations with r2=0.8948.
The phosphorus concentration measured by icp-ms in the sample from patient with
myeloma and in 10 samples from healthy control group showed no difference
between the patient sample and the control group. That led us to believe that the spurious
increase of phosphates is caused by interference with molybdate uv assay rather
than by biologically unavailable phosphates bound to the monoclonal protein.
This was confirmed by observing unusual turbidity in the tube with patient
sample, when we simulated the automatic process manually, in opposition to the
tubes with healthy control samples, which remained clear. Also, the
retrospective inspection of the diagram gained from reaction monitor option of
the analyzer showed a visible rise in absorbance, which was gradually
increasing during the measurement, which assured us of our conclusion. We
assume that it is the turbidity forming continuously during the 10 minute
measurement and thus creating the interference. Similar finding had been
observed in reaction curve from advia 1650 (siemens healthineers, erlangen,
germany) with the same method principle8.
The number of patients diagnosed with multiple myeloma is growing, which can be
among other reasons related to the rising median of life expectancy18. The database of brno university hospital
comprise of 200 patients with diagnosed multiple myeloma. Retrospectively, we
discovered other two more patients with pseudohyperphosphatemia. These cases
with other rare cases described in literature2-4,6-12,14,16
show, that it is necessary to keep this interference in mind when
evaluating the results. In case of any suspicious result, we suggest to use the
procedure with deproteination by sulfosalycilic acid, as used in literature2-4,6,7,14,16.
4. Conflict of interest
None
declared.
References
1. Jabor
a. Vnitřní prostředí. 1st ed. Praha: grada, 2008:530.
5. Larner
j. Pseudohyperphosphatemia. Clin biochem 1995;28(4):391-393.
11. Oren
s, feldman a, turkot s, et al. Hyperphosphatemia in multiple myeloma. Ann
hematol 1994;69:41-43.
12. Mavrikakis
m, vaiopoulos g, athanassiades p, et al.
Pseudohyperphosphatemia in multiple myeloma. Am j hematol
1996;51:178-179.
14. Izzedine
h, camous l, bourry e, et al. The case ∣
the case presentation. Kidney int 2007;72:1035-1036.
15. Mcclure
d, lai lc, cornell c. Pseudohyperphosphataemia in patients with multiple
myeloma. J clin pathol 1992;45:731-732.
17. Phosphate
(inorganic) ver.2 (package insert). Basel: roche diagnostics documentation;
2017.