What Do Longitudinal Voice Measurements Sample? Patient Specificity, Temporal Sampling and Disease-State Reconstruction in Parkinson’s Disease
Abstract
Background:
Remote voice monitoring provides
detailed long-term observations in Parkinson’s Disease (PD), but frequent
sampling does not necessarily mean accurate tracking of disease progression
within patients.
Objective:
To evaluate patient specificity,
temporal sampling and disease-state reconstructability in the Oxford
Parkinson’s Disease Telemonitoring dataset as an empirical proof of concept for
biomedical sampling-neutrality and reconstruction underdetermination.
Methods:
There were 5875 voice samples, which 42
people delivered. As the same subjects were recorded multiple times at the same
time points, 2,501 visit-level observations were generated by averaging the
voice measures within each subject-time point. These were used for the primary
analyses. The analysis included the examination of patient-specific UPDRS
trajectories, Intraclass Correlations (ICC), inter- and intra-patient voice
associations, intra-patient principal components, subject-grouped
cross-validation, forward temporal prediction and random temporal thinning of
directly measured voice variables.
Results:
The motor and total UPDRS tests depend
a lot on the patient with good reliability (ICC=0.927 and 0.943). The slopes
for motor UPDRS were positive in 28 out of 42 participants and negative in 14
out of 42 participants. The total UPDRS slopes were positive in 28 out of 42
participants and negative in 14 out of 42 participants. The overall correlation
between voice and UPDRS was moderate. The maximum of both worked-out and total
correlation achieved |rho|=0.204 and |rho|=0.179 whereas patient-wise correlation
was small with a maximum value of |rho|=0.054 and |rho|=0.041. The first within-patient
voice component accounted for 66.9% of voice variance; it was almost unrelated
to within-patient motor UPDRS (rho=-0.022), total UPDRS (rho=-0.022) and
elapsed time (rho=-0.008). Analysis of voice-only ridge models for motor and
total UPDRS in unseen-patient grouped validation yield negative R2.
The final 30% of
observations were predicted well (R²=0.797
and 0.838) by known-patient baseline models, showing no improvement with voice
variables. When applying random thinning at a period of 0.046, the median
voice-feature reconstruction correlation drops from 0.192 to 0.046.
Conclusion:
Repeated voice measurements contained
substantial patient-specific structure but limited evidence of within-patient
tracking of interpolated UPDRS progression in this dataset. Dense observations
therefore should not be equated with unique disease-state reconstruction.
Keywords:
Parkinson’s disease, Digital biomarkers, Voice, Longitudinal monitoring, Sampling,
Within-person analysis, Disease-state reconstruction, Telemonitoring
Abbreviations:
APQ11: 11-point amplitude perturbation
quotient; BioMeTs: Biometric Monitoring Technologies;
Biomedical Sampling-Neutrality: Methodological
proposition that sampling density and temporal discretization characterize the
observation protocol rather than the disease’s intrinsic temporal granularity; DFA:
Detrended Fluctuation Analysis; Disease-State Reconstruction Underdetermination:
Methodological proposition that a clinical state may not be uniquely
reconstructible from the available measurement domain; GroupKFold: Grouped
K-Fold Cross-Validation; HNR: Harmonics-To-Noise Ratio; ICC: Intraclass
Correlation Coefficient; IQR: Interquartile Range; MAE: Mean Absolute Error; MAE:
Mean absolute error; MDS-UPDRS: Movement Disorder Society-sponsored revision of
the Unified Parkinson’s Disease Rating Scale; NHR: Noise-To-Harmonics Ratio; PC1:
First Principal Component; PCA: Principal Component Analysis; PD: Parkinson’s
Disease; PPE: Pitch Period Entropy; R²: Coefficient of Determination; RMSE: Root Mean
Squared Error; RPDE: Recurrence Period Density Entropy; SD: Standard Deviation;
UPDRS: Unified Parkinson’s Disease Rating Scale; V3: Verification, Analytical
Validation And Clinical Validation; ρ (rho): Spearman Rank Correlation
Coefficient
1. Introduction
Parkinson’s Disease
(PD) is classified as a progressive neurodegenerative disorder wherein its
clinical severity is routinely assessed with the help of structured rating
scales like the Unified Parkinson’s Disease Rating Scale and its Movement
Disorder Society revision1. The
episodic nature of the in-clinic assessment has given rise to remote digital
measurements that can capture the symptoms with greater fidelity and in more
naturalistic settings2,3.
Remote monitoring of
voice is especially attractive because dysphonia is common in PD and acoustic
measures can be collected noninvasively. According to Tsanas,
et al.4, the combinations of voice features shown in the
Oxford telemonitoring study could estimate the clinician-derived values of
UPDRS and help show that speech-based remote monitoring may be feasible.
Previous research demonstrated that in a study5,
nonlinear and conventional dysphonia measures, like pitch period entropy and
harmonics-to-noise measures, could discriminate PD-related voice impairment.
Over the last years, researchers continue to endorse speech as a promising
digital biomarker. Moreover, heterogeneity, validation requirements, as well as
longitudinal evidence were emphasized6,7.
A factor that
differentiates individuals whose average severity of disease differs does not
necessarily correlate with changes over time within the same individual.
Longitudinal methodology clearly categorizes between-person effects and
within-person effects since aggregation across individuals can produce
associations that are weak, absent or reversed at the individual level8.
The present study is a
test of two active propositions as reflected by the Oxford Parkinson
telemonitoring dataset. The Biomedical Sampling-Neutrality theorem describes an
observation protocol consisting of dense or discrete time-stamped measurements;
but this does not, by itself, establish the temporal structure or
reconstructability of the disease. The phenomenon of Disease-State
Reconstruction Underdetermination suggests that a clinical state may be not
uniquely reconstructible from an available measurement domain in new patients.
The purpose was not to
surpass previously published models for UPDRS prediction. Rather, how strongly
do the observed UPDRS levels reflect patient-specificity? What percentage of
the voice-UPDRS associations persists between separating out of the within-patient
and between-patient information? How well do voice measures generalize to
unseen patients as opposed to future measurements of already observed patients?
How does temporal thinning affect the reconstruction of the voice state that
was directly measured?
2. Materials and Methods
2.1. Dataset and
preprocessing
Tsanas
et al.4 described the Oxford Parkinson’s
Disease Telemonitoring dataset used in the analysis. The dataset contains a
total of 5875 recordings from 42 subjects in the early stages of PD. Each of
the 5875 recordings has a wealth of information. The person’s subject
identifier, age, sex and time from recruitment. Also, we have linearly
interpolated motor and total UPDRS and a total of 16 acoustic voice
measurements. The dataset documentation clearly indicates that motor UPDRS and
total UPDRS are clinician scores through linear interpolation. There were no
missing values.
Multiple recordings of
the same song were often made at the same subject-specific test time. To
prevent treating same-time duplicates as separate temporal visits, primary
analyses collapsed the data to 2,501 unique subject-time observations by
averaging out voice variables within a subject-time duplicate.
2.2. Patient-specific
trajectory analysis
The immediate change
for each participant was defined as the least-squares slope of the motor and
total UPDRS versus test time. That slope was converted to a change per 30 days.
We calculated Spearman correlations for each UPDRS outcome in relation to time.
We obtained ICCs with random-intercept mixed models.
2.3. Between-person
and within-person voice associations
The subject mean was
defined as the between-person component for each acoustic variable X and the
visit-specific deviation from that mean was defined as the within-person
component. Spearman correlation was calculated before and after person-mean
centering. We utilized cluster-robust regression models that included age, sex,
centered time, a standardized between-person voice component and a standardized
within-person component5.
2.4.
Latent voice-state analysis
The voice variables of
16 people were standardized and underwent PCA. We used the correlations of PC1
with within-person motor UPDRS, total UPDRS and elapsed time to evaluate
whether the dominant acoustic state axis operated like a simple progression coordinate.
2.5.
Patient-aware predictive validation
Group K Fold cross-validation with seven folds was applied with a
generalization to unseen patients whereby all visits of each patient were
assigned to that patient’s fold. The analysis of age+sex+time, voice-only and
combined predictors found utility of ridge regression and histogram gradient
boosting. Independent of each participant’s visits is what forward prediction
of known patients is trained on.
2.6.
Temporal thinning of directly measured voice data
Re-interpolating the
thinned UPDRS data would be circular because the dataset already contains
linear interpolated UPDRS outcomes. The voice features used in the sampling
experiment were all measured directly. To create a smaller set of voices, we
maintained the first and last observation and thinned out visits by 75%, 50%,
25% and 10%. Linear interpolation was used to construct omitted values. Each
retention condition was executed 50 times.
2.7. Statistical
interpretation
Focus was on the magnitude of the effect, within versus between decomposition, patient level validation and sensitivity patterns. Cluster-robust models give two-sided p values for reference. The analysis employed Python, pandas, SciPy, statsmodels and scikit-learn.
3. Results
3.1. Sample structure
There were 2,501 unique subject-time visits, derived from 5,875 recordings. Study participants made a median of 59 visits (range 39-78) over a median follow-up of 170.5 days (Table 1).
Table 1: Dataset and participant characteristics.
|
Characteristic |
Value |
|
Subjects |
42 |
|
Original voice recordings |
5875 |
|
Unique subject-time visits |
2501 |
|
Male / female subjects |
28 / 14 |
|
Age, years |
64.4 ± 9.2
(36-85) |
|
Visits per subject |
median 59 (range 39-78) |
|
Follow-up, days |
median 170.5 (range 153.0-204.0) |
|
Motor UPDRS |
21.05 ±
7.99 |
|
Total UPDRS |
28.76 ±
10.55 |
|
Missing values |
0 |
3.2. UPDRS
trajectories were strongly patient-specific
The interclass correlation coefficient for motor UPDRS was 0.927 and for total UPDRS it was 0.943. The change in direction varied between the participants. A total of 28 participants had positive motor slopes and another 14 had negative motor slopes. The same number of participants had a total UPDRS score that was either positive or negative (Table 2, Figure 1 and 2).
Table 2: Patient-specific UPDRS trajectory heterogeneity.
|
Outcome |
ICC |
Positive slopes |
Negative slopes |
Median change/30 d (IQR) |
Median rho(time,outcome) |
Range of rho |
|
Motor UPDRS |
0.927 |
28 (66.7%) |
14 (33.3%) |
0.46 (-0.19 to 1.10) |
0.630 |
-0.999 to 1.000 |
|
Total UPDRS |
0.943 |
28 (66.7%) |
14 (33.3%) |
0.82 (-0.14 to 1.31) |
0.798 |
-0.999 to 0.999 |

Figure 1: Motor UPDRS trajectories across the 42 participants. Each line represents one participant.
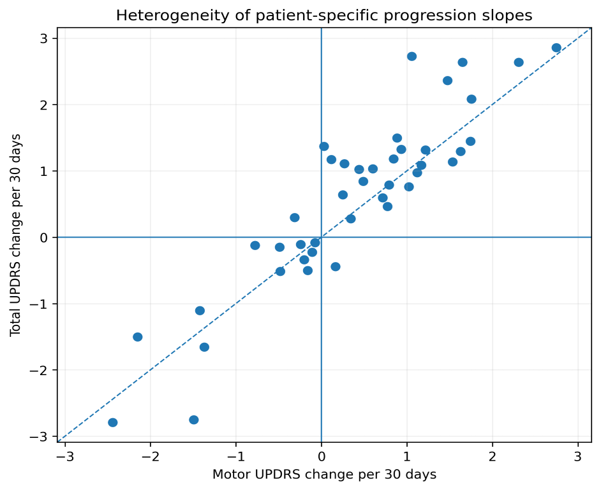
Figure 2: Patient-specific 30-day motor and total UPDRS slopes. The wide spread illustrates heterogeneous temporal direction and magnitude.
3.3. Overall voice
associations largely disappeared within patients
The strongest connection with a motor assessment of the UPDRS was with Shimmer: APQ11 (rho=0.179), reflecting the association of the visit level. The highest within-patient correlations observed were merely 0.054 (Table 3 and Figure 3).
Table 3: Cluster-robust decomposition of selected voice-UPDRS associations.
|
Outcome |
Voice feature |
Between-person beta |
Between p |
Within-person beta |
Within p |
|
Motor UPDRS |
Shimmer: APQ11 |
0.187 |
0.073 |
-0.007 |
0.662 |
|
Motor UPDRS |
NHR |
0.136 |
0.080 |
-0.009 |
0.377 |
|
Motor UPDRS |
HNR |
-0.189 |
0.102 |
0.015 |
0.279 |
|
Motor UPDRS |
PPE |
0.198 |
0.117 |
-0.009 |
0.387 |
|
Motor UPDRS |
RPDE |
0.208 |
0.155 |
-0.017 |
0.319 |
|
Motor UPDRS |
DFA |
-0.103 |
0.463 |
-0.015 |
0.188 |
|
Total UPDRS |
Shimmer: APQ11 |
0.150 |
0.100 |
-0.004 |
0.772 |
|
Total UPDRS |
NHR |
0.130 |
0.086 |
-0.006 |
0.473 |
|
Total UPDRS |
HNR |
-0.200 |
0.078 |
0.011 |
0.257 |
|
Total UPDRS |
PPE |
0.183 |
0.114 |
-0.006 |
0.439 |
|
Total UPDRS |
RPDE |
0.241 |
0.086 |
-0.012 |
0.318 |
|
Total UPDRS |
DFA |
-0.110 |
0.421 |
-0.008 |
0.434 |

Figure 3: Overall, versus within-patient Spearman correlations between selected voice measures and motor UPDRS.
3.4. A dominant latent
voice axis did not behave as a disease-time coordinate
PC1 explained 66.9% of
within-patient acoustic variance and the first six components explained 95.6%.
PC1 was essentially unrelated to centered motor UPDRS (rho=-0.022), centered
total UPDRS (rho=-0.022) or centered elapsed time (rho=-0.008).
3.5. Unseen-patient
reconstruction and known-patient future prediction differed
Ridge modelling using voice features yielded negative R-squared for both outcomes in unseen-patient grouped validation. After availability of a subject-specific baseline, visiting frequency and PD-status baseline-model predicted the last 30 per cent of visits in PD-subjects quite well (R²=0.797 for motor and 0.838 for total UPDRS). The introduction of centered time led to modest improvements; the incorporation of all 16 features had a minimal effect on the R² value (Table 4 and Figure 4).
Table 4: Patient-aware predictive validation.
|
Validation |
Outcome |
Model |
R2 |
MAE |
RMSE |
|
Unseen-subject GroupKFold |
Motor UPDRS |
Age + sex + time |
0.017 |
6.819 |
7.920 |
|
Unseen-subject GroupKFold |
Motor UPDRS |
Voice only |
-0.135 |
7.140 |
8.513 |
|
Unseen-subject GroupKFold |
Motor UPDRS |
Time + demographics + voice |
-0.136 |
7.103 |
8.514 |
|
Unseen-subject GroupKFold |
Total UPDRS |
Age + sex + time |
0.087 |
8.455 |
10.084 |
|
Unseen-subject GroupKFold |
Total UPDRS |
Voice only |
-0.088 |
8.962 |
11.005 |
|
Unseen-subject GroupKFold |
Total UPDRS |
Time + demographics + voice |
-0.045 |
8.791 |
10.784 |
|
Known-patient future 30% |
Motor UPDRS |
Baseline mean |
0.797 |
2.872 |
3.748 |
|
Known-patient future 30% |
Motor UPDRS |
Baseline + centered time |
0.800 |
2.727 |
3.719 |
|
Known-patient future 30% |
Motor UPDRS |
Baseline + centered time + voice |
0.801 |
2.736 |
3.715 |
|
Known-patient future 30% |
Total UPDRS |
Baseline mean |
0.838 |
3.535 |
4.406 |
|
Known-patient future 30% |
Total UPDRS |
Baseline + centered time |
0.851 |
3.093 |
4.226 |
|
Known-patient future 30% |
Total UPDRS |
Baseline + centered time + voice |
0.852 |
3.084 |
4.217 |

Figure 4: Out-of-fold R² for ridge models evaluated in previously unseen patients.
3.6. Temporal thinning
reduced voice-state reconstruction
From 75% retention to
10% retention, the median feature-level reconstruction correlation went down
from 0.192 to 0.046. The normalized RMSE remained about one SD within person,
suggesting that even at quite dense sampling interpolation was not complete (Table 5 and Figure 5).
Table 5: Temporal thinning experiment for directly measured voice features (50 random repetitions).
|
Retained observations |
Median feature r |
Normalized RMSE |
|
75% |
0.192 ± 0.027 |
1.215 ± 0.029 |
|
50% |
0.143 ± 0.024 |
1.250 ±
0.024 |
|
25% |
0.087 ± 0.020 |
1.262 ±
0.025 |
|
10% |
0.046 ±
0.015 |
1.254 ±
0.032 |
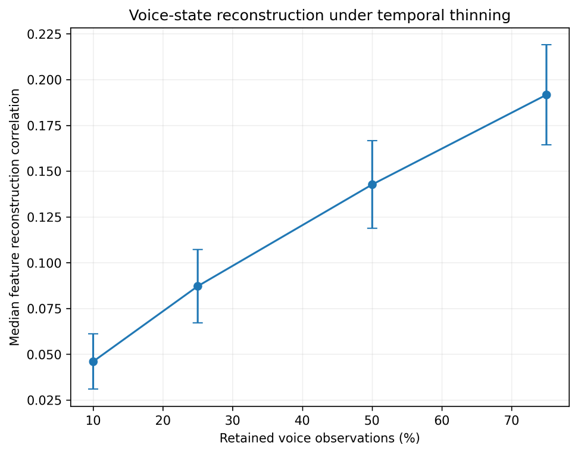
Figure 5: Mean median feature-level reconstruction correlation under random temporal thinning; error bars show the standard deviation across 50 repetitions.
4. Discussion
Tsanas,
et al.,4 predicted that the UPDRS would be
more or less predictable using an Oxford study. The current analysis tackles a
different question: Do those dense repeated measurements act as genuine
within-patient progression trackers and does increased sampling uniquely
reconstruct disease state?
One principal finding
was a distinct separation of patient specificity and within-patient tracking.
Stable between-person differences were the main source of UPDRS variance. There
were some overall associations with the acoustic features but they were fairly
modest and they disappeared after person-mean centering. This illustrates why
progression biomarkers should not only be assessed using pooled associations9,10.
As digital biomarkers
evolve from infrequent clinical tests to home-based repeated measurements, this
distinction becomes increasingly relevant2,3,11-14.
The V3 framework asserts that clinical validation is contextual since a measure
that is technically valid for discrimination may not be so for progression10,15,16.
The other major
finding is disagreement between unseen-patient and known-patient
reconstruction. The voice models were not able to generalize to new
participants well, whereas the baseline of the patient in the past gives a lot
of predictive information about the future observations. This implies that a
digital measure's information content is partially dependent on its reference
history - the history in which we interpret it9,17.
The third finding was
temporal density. As UPDRS values were already interpolated, the appropriate
application of the sampling experiment was conducted to the directly measured
voice features. Although interpolation improved due to better retention, correlations
were still weak. The improved measurement density can give better access to the
observed signal without guaranteeing full reconstruction of the underlying
state7,13,14.
The aforementioned
results motivate two methodological precautions. Biomedical Sampling-Neutrality
characterizes an observation protocol by sampling density and temporal
discretization, not the disease’s intrinsic temporal granularity. The state of
the disease is reconstructed based on the finite measurement domain, which may
underdetermine if clinical state can be inferred uniquely. This also holds for
patient across the board. Both propositions do not provide a new biological
law. They are analytical restrictions on our inferences10,15,16.
The results should not
be read as evidence against the speech biomarkers. Recent literature provides
evidence for longitudinal and treatment-sensitive speech changes examined with
more up-to-date protocols, including natural speech, richer acoustic features
and treatment-state contrasts6,18,19.
According to recent systematic reviews, however, there is still a stronger
validation gap in the longitudinal progression sensitivity across digital
technologies3,7.
Future studies of
digital biomarkers should explicitly report progression performance separately
for between-person discrimination, within-person sensitivity to change,
unseen-patient generalization and incremental value beyond patient-specific
history. If the aim is to deploy the model to new individuals, data splitting
at the patient level should be considered essential9,17,20-22.
5. Limitations
Only 42 people in the
cohort made between-person inference and external validity limited. Clinician
scored motor and total UPDRS values are obtained through linear interpolation
rather than independent clinical examinations at each voice visit. Lack of medication
status, duration of disease, change in treatment, language, context and
detailed recording from the analytic file. Acoustic variables are closely
connected and some have a mathematical relationship. The temporal thinning
experiment is about evaluating the reconstructability of observed acoustic
features and not the unobserved biological disease process. The negative and
unseen patient R-values supersede this data set and modelling design and
shouldn’t be generalized to modern multimodal or deep learning speech systems.
The proposed conceptual principles are methodological constructs supported by
proof-of-concept analysis not stand-alone clinical laws.
6. Conclusion
The longitudinal voice measurements of the Parkinson telemonitoring dataset have a lot of patient-specific structure but little evidence of simple within-patient tracking of interpolated UPDRS progression. When centering within-person measures, cross-sectional associations weakened, while voice-based models did not generalize to new patients. Rather, future prediction was largely determined by patient-specific baseline knowledge. Through denser sampling reconstruction of states improves but is not guaranteed as seen through temporal thinning of acoustic features. What is more appropriate is not how often a signal can be sampled, but rather how much clinically relevant state can be identified from the accessible measurement domain for longitudinal digital biomarkers.
7. References
- Goetz
CG, Tilley BC, Shaftman SR, et al. Movement Disorder Society-sponsored revision
of the Unified Parkinson’s Disease Rating Scale (MDS-UPDRS): Scale presentation
and clinimetric testing results. Movement Disorders. 2008;23(15): 2129-2170.
- Espay
AJ, Hausdorff JM, Sánchez-Ferro Á, et al. A roadmap for implementation of
patient-centered digital outcome measures in Parkinson’s disease obtained using
mobile health technologies. Movement Disorders, 2019;34(5): 657-663.
- Sun
YM, Wang ZY, Liang YY, et al. Digital biomarkers for precision diagnosis and
monitoring in Parkinson’s disease. npj Digital Medicine. 2024;7: 218.
- Tsanas
A, Little MA, McSharry PE, et al. Accurate telemonitoring of Parkinson’s
disease progression by noninvasive speech tests. IEEE Transactions on
Biomedical Engineering. 2010;57(4): 884-893.
- Little
MA, McSharry PE, Hunter EJ, et al. Suitability of dysphonia measurements for
telemonitoring of Parkinson’s disease. IEEE Transactions on Biomedical
Engineering, 2009;56(4): 1015-1022.
- Rusz
J, Krack P, Tripoliti E. From prodromal stages to clinical trials: The promise
of digital speech biomarkers in Parkinson’s disease. Neuroscience &
Biobehavioral Reviews. 2024;167: 105922.
- Rábano-Suárez
P, Del Campo N, Benatru I, et al. Digital outcomes as biomarkers of disease
progression in early Parkinson’s disease: A systematic review. Movement
Disorders. 2025;40(2): 184-203.
- Wang
LP, Maxwell SE. On disaggregating between-person and within-person effects with
longitudinal data using multilevel models. Psychological Methods. 2015;20(1):
63-83.
- Chaibub
Neto E, Pratap A, Perumal TM, et al. Detecting the impact of subject
characteristics on machine learning-based diagnostic applications. npj Digital
Medicine. 2019;2: 99.
- Roussos
G, Ruiz Herrero T, Hill DL, et al. Identifying and characterizing sources of
variability in digital outcome measures in Parkinson’s disease. npj Digital
Medicine. 2022;5: 93.
- Bot
BM, Suver C, Chaibub Neto E, et al. The mPower study, Parkinson disease mobile
data collected using ResearchKit. Scientific Data. 2016;3: 160011.
- Zhan
A, Mohan S, Tarolli C, et al. Using smartphones and machine learning to
quantify Parkinson disease severity: The Mobile Parkinson Disease Score. JAMA
Neurology. 2018;75(7): 876-880.
- Burq
M, Rainaldi E, Ho KC, et al. Virtual exam for Parkinson’s disease enables
frequent and reliable remote measurements of motor function. npj Digital
Medicine. 2022;5: 65.
- Czech
MD, Badley D, Yang L, et al. Improved measurement of disease progression in
people living with early Parkinson’s disease using digital health technologies.
Communications Medicine. 2024;4: 49.
- Coravos
A, Khozin S, Mandl KD. Developing and adopting safe and effective digital
biomarkers to improve patient outcomes. npj Digital Medicine. 2019;2: 14.
- Goldsack
JC, Coravos A, Bakker JP, et al. Verification, analytical validation and
clinical validation (V3): The foundation of determining fit-for-purpose for
Biometric Monitoring Technologies (BioMeTs). npj Digital Medicine. 2020;3: 55.
- Karbalaie
A, Abtahi F, Häger CK. Participant-aware model validation for repeated-measures
data: Comparative cross-validation study. JMIR AI. 2026;5: 87728.
- Sousa
M, Krýže P, Amstutz D, et al. Digital speech biomarkers can measure acute
effects of levodopa in Parkinson’s disease. npj Parkinson’s Disease. 2025;11:
184.
- Šimek
M, Tykalová T, Novotný M, et al. Speech biomarkers from smartphone calls track
progression in REM sleep behavior disorder and Parkinson’s disease. Annals of
Neurology. 2026;99(4): 935-948.
- Farajollahi
B, Saffarian A, Habibi SAH, et al. Diagnosis of Parkinson’s disease based on
voice and speech using machine learning and deep learning: A systematic
umbrella review. Journal of Voice. Advance online publication, 2026.
- FDA-NIH Biomarker Working Group. (2016-2025). BEST (Biomarkers, EndpointS and other Tools) Resource. U.S. Food and Drug Administration and National Institutes of Health.
- Rovini
E, Maremmani C, Cavallo F. How wearable sensors can support Parkinson’s disease
diagnosis and treatment: A systematic review. Frontiers in Neuroscience.
2017;11: 555.