Comparison of Some Brazil and Mexico ADR Rotation Strategies
A B S T R A C T
This study evaluates a
median sector rotation strategy using American Depositary Receipts (ADRs) from
Brazil and Mexico during 2014-2024, a period shaped by tariff shocks and policy
uncertainty. Unlike momentum-driven approaches, the median strategy systematically
avoids extreme sector performers, aiming to reduce volatility and drawdowns for
retail investors. Portfolios were tested under five rebalancing
frequencies—weekly to annual—using total returns, Sharpe ratios and maximum
drawdowns as evaluation metrics. Results indicate that monthly and semi-annual
rotations deliver favorable risk-adjusted performance, particularly during
heightened market turbulence. The findings suggest that median-based allocation
offers a pragmatic, accessible mechanism for individual investors to achieve
stability and moderate growth without reliance on predictive models or advanced
data infrastructure. Keywords: Trading strategies, Momentum strategies, Median
sector rotation, Emerging markets, ADRs, Portfolio rebalancing, Retail investor.
1. Introduction
With pockets of war occurring along with looming threats of
global markets closing, retail investors in emerging markets face
growing challenges amid rising macroeconomic uncertainty,
global trade tensions and volatile capital flows1,2. In countries
such as Brazil and Mexico, inflationary pressure, currency
instability and shifting tariff regimes have introduced heightened
risk exposure across equity markets3,4. Traditional passive
strategies, such as broad index investing, offer diversification
but leave public investors fully exposed to systemic shocks as
seen from the recent drastic drop of the S&P500 early 20253. At
the same time, most sophisticated factor-based or momentum
driven models remain out of reach for non-institutional investors
due to their complexity and data demands5,6
This paper investigates
the application of a median sector rotation strategy-a simple, rule-based
method that reallocates capital to sectors with moderate recent performance-as
a low complexity, risk-mitigating approach for the public. Building on prior work
in the U.S., India and Japan7, we extend the strategy to Latin American
markets, using U.S.-listed ADRs as sectoral proxies. ADRs offer exposure to
Brazilian and Mexican equities through U.S. dollar-denominated instruments,
reducing the impact of currency fluctuations and improving accessibility and
liquidity for retail investors8.
Rather than targeting outperformance through
predictive signals, the median strategy acts as a volatility filter by
systematically avoiding the most extreme sector movement, acting as a
conservative investment for retail investors9. Given
2. Motivation and Context
In emerging markets like Brazil and Mexico,
most investment decisions are influenced by a combination of policy
uncertainty, currency pressure and trade-related shocks, often closely tied to
the US market1. These influences have contributed to uneven performance across
sectors, with trade-heavy industries reacting sharply to changes in tariffs,
inflation or capital flows. For both institutional and retail investors, this
environment raises a practical concern: how to can you invest without taking on
unnecessary risk in sectors most exposed to external disruptions2.
Passive
strategies, while easy to implement, offer little room to adjust for concentrated
risks that emerge in unstable macro conditions. At the same time, active models
often depend on forecasting tools or data infrastructure that most retail
investors can’t access or apply consistently. This leaves a gap between
accessibility and adaptability that few strategies manage to bridge4
A more pragmatic approach
may be to sidestep the extremes. The median sector rotation strategy does this
by reallocating capital to sectors that sit in the middle of recent performance
rankings. It foregoes top performers and chronic underperformers. And instead,
it aims to reduce overall volatility by focusing on more stable segments of the
market (?). This can be particularly useful during periods when sector-level
performance is driven more by policy headlines – as seen from Trump’s recent
introduction of tariffs – than by fundamentals.
The current backdrop adds
weight to this idea. Since early 2025, new U.S. tariffs targeting Brazilian and
Mexican exports especially steel, agricultural products and manufactured
goods-have triggered sharp market reactions3. These trade actions, alongside
weakening local currencies and rising prices, have made returns more erratic
and sector dispersion more pronounced. In this context, a basic rotation
strategy that f ilters out the outliers may offer a degree of protection
without requiring predictive models or high-frequency trading10.
To evaluate
this, the study uses American Depositary Receipts (ADRs) as sector proxies.
ADRs trade in U.S. dollars and offer retail investors simpler access to
international equity exposure with fewer currency-related complications8. We
test the median strategy across different rebalancing cycles and compare its
outcomes with approaches that emphasize either the best- or worst performing
sectors. The goal of our paper is to understand whether a structured yet simple
method of investing using medians can provide a useful buffer in markets where
volatility is becoming a constant.
This work contributes to the broader
conversation about building accessible, data-driven investment frameworks that
can adapt to instability without overcomplicating execution and providing
accessibility for retail investors that do not have the resources to engage
experts2. It focuses on what can be done with basic return data-no forecasts,
no proprietary inputs-so that individual investors have a clearer path forward
in uncertain times.
3. Methodology.
3.1. Sector selection and
Data sources
To evaluate the effectiveness of the median sector rotation
strategy in a Latin American context, we constructed investment portfolios
using American Depositary Receipts (ADRs) representing key sectors from Brazil
and Mexico - the only two countries that had enough ADR based on our threshold
of more than 10 ADRs. ADRs were selected based on liquidity, sectoral
representation and data availability on U.S. exchanges. This approach provides
public investors with U.S. dollar denominated access to Latin American equities
while minimizing friction from local brokerage access, currency volatility and
data opacity (we forego including the cost of trading these ADR with the
assumption that investors would absorb a similar fee in purchasing other
investment products) (Table 1).
|
Ticker |
Name |
Industry
Sector |
|
SID |
Companhia Siderurgica Nacional |
Steel/Basic materials |
|
GGB |
Gerdau S.A. |
Steel/Basic Materials |
|
SBS |
Companhia de Saneamento Basico
do Estado de Sao Paulo |
Utilities |
|
SUZ |
Suzano, S.A. |
Paper |
|
VALE |
Vale S.A. |
Metals/Mining |
|
PBR |
Petroleo Brasileiro
S.A. - Petrobras |
Oil and Gas |
|
ITUB |
Itau Unibanco Holding
S.A. |
Banks |
|
BAK |
Braskem S.A. |
Chemicals |
|
BBD |
Banco Bradesco S.A. |
Banks |
Table 2: List of Maxico ADRs.
|
Ticker |
Name |
Industry
Sector |
|
AMX |
America Movil |
Telecom |
|
ASR |
Grupo Aeroportuario
del Sureste |
Airports |
|
CX |
CEMEX |
Building Materials |
|
FMX |
Fomento Economico Mexicano |
Beverages |
|
KOF |
Coca-Cola FEMSA |
Beverages |
|
OMAB |
Grupo Aeroportuario
del Centro Norte |
Airports |
|
PAC |
Grupo Aeroportuario
del Pac´ıfico |
Airports |
|
SIM |
Grupo Simec |
Steel |
|
VLRS |
Controladora Vuela Compan´ıa de Aviacion |
Airlines |
These sectors were grouped into broader economic categories
using Global Industry Classification Standard
(GICS) mappings. From each country, we selected between 7 to 10 ADRs representing distinct economic
sectors to ensure a balance between coverage
and data quality.
Daily closing prices were collected from Yahoo Finance
and other public financial APIs covering the ten-year period 2014-2024, a
timeframe that includes both stable conditions and periods of macroeconomic
disruption, including trade policy shocks and inflation surges.
3.1.
Portfolio construction and Sector ranking
Following the methodology established in prior studies, sectors were
ranked by total return over a fixed rebalance interval. For each period,
sectors were categorized into the following portfolios:
• Winner Portfolio - Top 3 ADRs by return.
•Loser Portfolio
- Bottom 3 ADRs by return.
• Median Portfolio
- Middle 3 ADRs by return.
Let us consider a simple
numerical example. The initial amount of investment for each group
is set at $100. The trading
strategy for annual rebalancing is to look at previous years sorted returns
and invest in winners, median
and losers. Suppose that the 2014 returns
of ADRs in increasing order
are as follows:
For 2015, the “Winners”
strategy is to invest equally in (BBB, ITUB, SUZ). The “Median” strategy would
be to invest equally in (BAK, SBS, VALE) stocks. Finally, the “Losers” strategy
would be to invest equally in (PBR, GGB, SID) stocks.
3.3.Rebalancing
frequencies
To assess how timing
influences strategy performance, we tested five rebalancing intervals:
• Weekly
•Monthly
•Quarterly
•Semi-Annual
•Annual
This design allows us to
evaluate whether the median strategy’s advantages hold under both high frequency
and low-frequency reallocation regimes.
3.4.Performance evaluation metrics
We
evaluated each strategy using both absolute and risk-adjusted
metrics:
• Final portfolio
value: Ending value after compounding
returns.
• Annual Return.
• Annual
volatility: Standard deviation of returns.
• Tracking error: Difference from benchmark B&H
performance.
•Maximum drawdown
(MDD): Largest observed
peak-to- trough decline.
•Sharpe
ratio: Risk-adjusted return.All metrics were computed
using Python and the empyrical library (Package). Returns were calculated in
U.S. dollars, consistent with the ADR pricing
convention and dividends were excluded to preserve comparability across listings.
3.5.Key assumptions and Limitations
•Transaction
costs: As mentioned, we assumed that purchasing
other investment product will have a similar transaction cost hence in this
paper we assume that the transaction cost is irrelevant.
•Survivorship
bias: We mitigated this by using ADRs that had remained continuously listed
through the 2014–2024 window.
•Sector drift: Given
theADR format, the sector classifications should remain
stable; however, we recognize the limitation
of not capturing smaller or non-U.S.-listed regional
players.
4.Results and Findings (Mexico
ADR Sector Rotation)
4.1Performance by rebalancing frequency
The rotation strategy performance exhibits noticeable variation
depending on the rebalancing frequency, as highlighted by the cumulative cash values and maximum drawdown
(MDD) metrics.
Cumulative Cash Values The cumulative terminal
values (in units of initial capital)
demonstrate that the choice of rebalancing
frequency strongly influences portfolio growth potential. As shown in (Table 3) annual rebalancing yields
moderate results, with the Winners
portfolio growing to 193 and the Median and Losers portfolios reaching 233
and 248 respectively, all outperforming the Buy-and-Hold baseline of 101.
Increasing the rebalancing
frequency to Semi-Annual and Quarterly notably improves performance for some
groups; for example, the Median portfolio achieves its highest terminal value
of 345 under Semi-Annual rebalancing, while the Losers portfolio peaks at 432
under Quarterly rebalancing. Monthly rebalancing provides the highest growth
for the Winners portfolio (319), suggesting that adapting portfolio weights more
frequently can better capture momentum effects.
Interestingly, the Losers portfolio does not uniformly
decline but occasionally achieves
strong growth (e.g.,
432 at Quarterly), indicating potential profit opportunities even
among previously underperforming ETFs if rebalancing is frequent enough.
Weekly rebalancing results in
respectable but not always superior cumulative values compared to Monthly or
Quarterly, hinting at possible diminishing returns.
Maximum Drawdown
(MDD) The MDD analysis reveals
the downside risk accompanying each rebalancing frequency. Lower (less negative) MDD values indicate
better capital preservation.
As shown in (Figure 2) Annual and Semi-Annual frequencies
produce
generally lower drawdowns for the Winners portfolio (around -0.60 to -0.68),
reflecting a balance between return and risk.
The Median and Losers portfolios experience slightly larger drawdowns, especially under higher
frequencies like Quarterly and Weekly, where MDD ranges from -0.62 to -0.77.
The Buy-and-Hold strategy,
despite its relatively low returns, displays the smallest drawdown (-0.57),
demonstrating its conservative risk profile.
The results underscore the
classic trade-off: more frequent rebalancing can enhance returns by exploiting
changing market momentum but may increase volatility and susceptibility to
deeper drawdowns.
Summary: the cash values and
MDDs across different rebalancing intervals illustrate clear performance and
risk trade-offs. Monthly and
Quarterly rebalancing frequencies appear to offer favorable combinations of
growth and control over downside risk for Winner’s portfolios, while less
frequent rebalancing such as Annual or Semi-Annual may appeal to investors
prioritizing lower volatility. These findings can guide practitioners in
calibrating rotation strategies to their risk tolerance and market outlook.
4.2.Performance by rebalancing frequency: Mexico portfolio
The rotation strategy
applied to Mexican
ETFs demonstrates significant
variation in performance and risk across different portfolio rebalancing
frequencies, as seen through cumulative cash values and maximum drawdown (MDD)
statistics.
Cumulative Cash Values The
terminal portfolio values indicate that rebalancing frequency has a marked impact on portfolio growth potential. As
shown in Table 4 Annual rebalancing delivers modest growth, with the Winners
portfolio reaching 157 and the Median and Losers portfolios at 142 and
362 respectively, all exceeding the baseline Buy-and-Hold value of 100.
Semi-Annual rebalancing
markedly boosts the Median portfolio’s terminal value to 429, reflecting that less frequent
but regular adjustments can sometimes better
capture medium-term momentum.
Quarterly rebalancing also improves the Winners portfolio (206), while Monthly
rebalancing produces the most substantial growth in the Winners
group (325), confirming that more frequent portfolio
updates can intensify returns by exploiting recent performance trends.
Notably, the Losers portfolio
shows strong terminal values under Annual (362) and Weekly (461) rebalancing, which
suggests unique market behaviors or opportunities for reversal strategies among
underperforming Mexican ETFs.
Weekly rebalancing results are mixed, showing
high returns for the Losers group but significantly lower performance for Winners (69), indicating potential
risks or inefficiencies associated with very short-term rotation.
Maximum Drawdown (MDD) The MDD values highlight the
downside risks inherent in each rebalancing frequency. As shown
Median portfolios
experience their lowest drawdowns around
-0.48 annually and -0.55 with
weekly adjustments, showing relative stability in moderate performers. Losers
suffer larger drawdowns in most cases, particularly under Semi-Annual and
Weekly rebalancing (-0.70 and -0.68), revealing increased risk in frequently
rotated underperformers.
The Buy-and-Hold approach,
while generating the least returns, maintains a stable and moderate drawdown
(-0.54), underscoring its conservative nature.
Summary: The Mexico portfolio
results underscore the trade-offs between return
enhancement and risk control inherent in choosing a rotation
frequency. Monthly rebalancing excels in delivering superior growth with the lowest drawdowns for Winners, whereas Semi-Annual
rebalancing significantly benefits Median portfolios. Annual and Weekly
frequencies display divergent results particularly for Losers, highlighting
market-specific effects (Figure 1).
These insights assist investors in tailoring rebalancing strategies according
to their risk tolerance and desire for return maximization in the Mexican ETF market (Tables 3 and 4).
Table 3: Brazil: Comparison of Strategies Final Balances for Different Rotation
Frequencies.
|
Strategy |
|
ROTATION
FREQUENCY |
|
||
|
Annual |
Semi-Annual |
Quarterly |
Monthly |
Weekly |
|
|
Winners |
193 |
257 |
277 |
319 |
253 |
|
Median |
233 |
345 |
97 |
248 |
187 |
|
Losers |
248 |
137 |
432 |
146 |
247 |
|
Buy & Hold |
|
101 |
|
||
Table 4: Mexico: Comparison of Strategies Final Balances for Different Rotation Frequencies.
|
Strategy |
|
ROTATION
FREQUENCY |
|
||
|
Annual |
Semi-Annual |
Quarterly |
Monthly |
Weekly |
|
|
Winners |
157 |
186 |
206 |
325 |
69 |
|
Median |
142 |
429 |
204 |
170 |
265 |
|
Losers |
362 |
86 |
201 |
143 |
461 |
|
Buy & Hold |
|
100 |
|
||

Figure 1: Brazil Comparing cash across various strategies and frequencies.
5.Conclusion
The median sector rotation strategy
provides a robust, low-complexity approach to navigating volatile emerging
markets impacted by policy shocks. Monthly and semi-annual rebalancing optimize
the balance between returns and risk. By avoiding extremes, this method offers
retail investors (Figures 2-6).
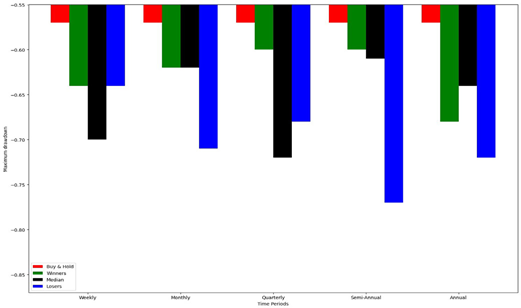
Figure 2: Brazil Comparing maxdrawdowns across various
strategies and frequencies.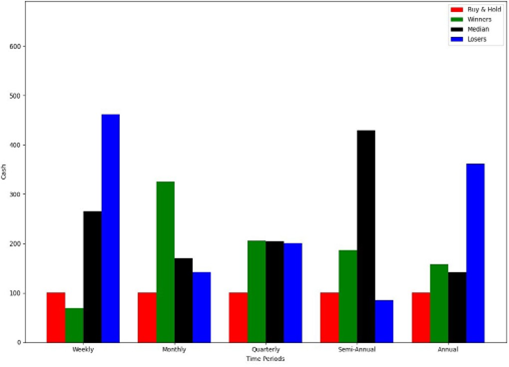
Figure 3: Mexico Comparing cash across various
strategies and frequencies.
Figure 4: Mexico Comparing maxdrawdowns across various
strategies and frequencies.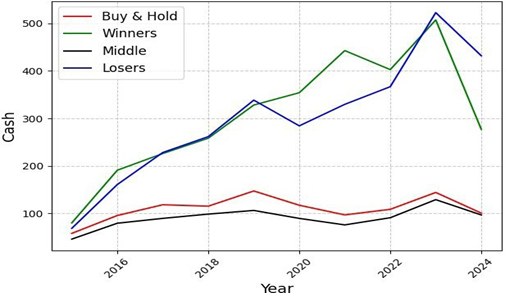
Figure 5: Brazil’s best investment strategy.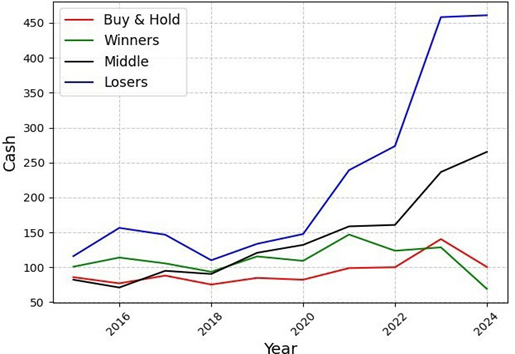
Figure 6: Mexico’s best investment strategy.
A practical alternative to
active forecasting models, enhancing stability without sacrificing growth
potential during periods of heightened uncertainty, such as those triggered by
recent U.S. tariffs on Latin American exports.
6.Acknowledgements
6.1.Conflict of interest
We declare that there are no conflicts of interest regarding the
publication of this paper.
6.2.Author contributions
All the authors contributed equally to the effort.
6.3.Funding
This research was conducted
without any external funding. All aspects of the study, including design, data
collection, analysis and interpretation, were carried out using the resources
available within the authors’ institution.
6.4.Data Availability (including Appendices)
All the relevant data, Python code for analysis, detailed annual
tables and graphs are available via: https://github.com/ traders2025/Rotation_Strategy_Brazil_Mexico/tree/main
7.References
- Alexiou C, Tygi A.
Gauging the effectiveness of sector rotation
strategies: Evidence from the u.s. and europe.
Journal of Asset
Management, 2020.
- Johnson AL. ETF Strategy: Sector Rotation. Wiley,
2024.
- Phillip C, Kim I, Cheh J. Sector rotation and interest rate policy.
International Journal of Business and Social
Research, 2014.
- Nadler D, Schmidt A. Momentum strategies for
etf-based portfolios. SSRN Electronic Journal, 2019.
- Nyaradi J. Super Sectors: How to Outsmart the Market
Using Sector Rotation. Wiley, 2010.
- Yang YH, Pinsky E.
A simple rotation strategy
with sector etfs. Technical Analysis of Stocks and Commodities,
2022;40(12): 36-40.
- Joshi A, Deshmukh
PK, Lohokare J. Comparative analysis
of vanilla lstm and peephole lstm for stock market
price prediction. In 2022 International Conference on
Computing, Communication, Security and Intelligent Systems
(IC3SIS), 2022: 1-6.
- Moreno L, Alvarez M. Emerging market
adrs as portfolio diversifiers. Latin American Journal
of Finance, 2021.
- Assogbavi T, Osagie JE, Frieder LA, et al. Investment strategies, performance and trading information impact.
Investment Review, 2011.
- Block J, Maewal A. Deep sector rotation swing trading. SSRN Electronic Journal, 2023.