Developing Machine-Learning Models to Classify the Seriousness of Road Traffic Injuries among Young Drivers
Abstract
This study develops and evaluates
machine-learning models to classify road-traffic injury severity among young
drivers using Israeli Central Bureau of Statistics data (2009-2019; N=37,499).
After extensive preprocessing, feature selection and hyperparameter tuning, an
Extra Trees Classifier achieved the best performance on a held-out test set:
accuracy = 0.98453, macro F1 = 0.9321. Top predictive features were: road
surface condition, traffic control type, posted speed limit, driver age and
vehicle type (SHAP analysis; top-5). Evaluation included stratified 5-fold
cross-validation, confusion matrices, calibration plots and permutation
importance. The manuscript details preprocessing, model selection,
reproducibility settings and policy implications for young-driver road safety.
Keywords:
Road traffic
injuries, Machine learning, Extra trees, Feature selection
1.
Introduction
1.1. Motivation
Less experienced and younger
drivers are disproportionately prone to being involved in severe automobile
accidents. This study categorizes drivers under the age of 24 as young drivers
and investigates various factors that increase the risk of serious traffic
accidents in this demographic. Factors include inherent attributes (age,
gender, driving experience) and behavioral aspects (social influences, driving
frequency).
The greater involvement of younger drivers in car collisions has been a persistent and concerning problem. According to the most recent ‘Traffic Safety Facts’ report by the National Highway Traffic Safety Administration (NHTSA), U.S. drivers in the age groups 16-20 and 21-24 exhibited the highest rates of fatal crash involvement in 2019 [1, 2]. Overall, there have been improvements in fatality statistics over the decades due to measures such as mandatory seatbelt use and improvements in vehicle safety. Thus, over the period from 1975 to 2019, the proportion of passenger-vehicle drivers engaged in fatal crashes in the USA dropped by 66% for teenagers aged 16-19, by 49% for those aged 20-34, by 35% for individuals aged 35-69 and by 19% for those aged 70 and older. Furthermore, the rate of fatal crashes involving teenage passenger-vehicle drivers in 2019 decreased for the third consecutive year and was 4% lower than the 2018 rate1,2. However, based on recent U.S. data from the National Center for Health Statistics (NCHS), motor vehicle accidents remain a leading cause of death among 15-24-year-olds3. Worldwide, 25% of deaths in individuals aged 16 to 20 can be attributed to motor vehicle crashes3, resulting in both physical and emotional hardships for the survivors and the families of those killed and injured. Additionally, society bears the burden of productivity loss and medical costs for young individuals who would otherwise be in good health.
Numerous intertwined factors contribute to crashes involving young drivers, which often arise from a combination of circumstances rather than a single driver error. Identifying and understanding how these factors cause a particular outcome is important in devising and implementing evidence-based policies to reduce fatalities among young drivers. The current study employs a machine-learning classification model to forecast the severity of injuries sustained by young drivers in vehicle accidents. The model considers three classes of injury severity: fatal, serious and slight. It is important to note that this model is designed specifically to predict the injury severity distribution within Israel, as it has been exclusively trained on Israeli traffic accident data (spanning from 2009 to 2019). Nevertheless, the model’s insights may be applicable to other countries with similar traffic conditions. Given the dynamic nature of the factors affecting injury severity in young drivers, we recommend continuous retraining of the model using new data to uphold its predictive accuracy.
Data concerning road traffic accidents involving young drivers in Israel from 2009 to 2019 are presented in (Figures 1 and 2). While the rates of fatalities and severe injuries do not seem to have shown an upward trend over time, their absolute levels are high. This underscores the importance of addressing safety concerns and risks associated with young drivers within the transportation system. Numerous studies have attempted to address these concerns and uncover the determinants of severe injuries in young drivers. These factors encompass demographic characteristics (e.g., age and gender), alcohol involvement type of collision, environmental conditions, road features, location, time of day and road illumination.
Figure 1: Fatalities among
drivers aged 20-24 throughout the years in Israel.
Figure 2: Young driver accident
severity distributions throughout the years in Israel.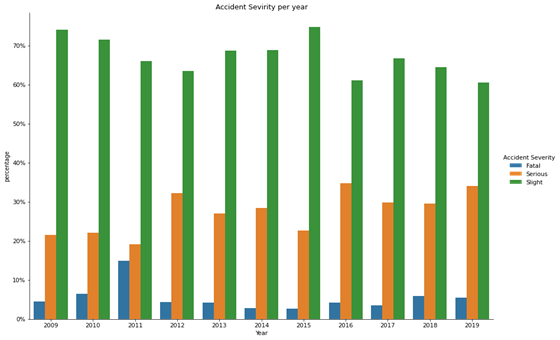
1.2. Literature review
Previous studies have sought
to uncover accident trends by analyzing comprehensive datasets containing
information on fatalities among young drivers. In this endeavor, researchers
have focused on distinguishing between attributes that have a substantial influence
on injury severity and those that have a minimal impact. This approach enables
the creation of precise models for predicting serious and fatal injuries among
young drivers. The traditional method for analyzing traffic safety has involved
establishing correlations between a broad spectrum of variables and the
incidence of crashes. Machine learning tools have gained widespread acceptance
among transportation safety researchers as a means of understanding the
determinants of injury severity in road traffic accidents. (Table 1)
provides an overview of the literature that has investigated the factors that
exert a substantial influence on the rate of severe injuries among young
drivers.
|
Category |
# |
Authors |
Explanatory variable |
Values |
|
|
Driver’s characteristics |
1 |
Peek-Asa17, Vachal19, Das20,
Sunanda42, Neyens39, Zhang53 |
Population setting |
Rural background, urban upbringing |
|
|
2 |
McCartt22, Gonzales28, Paleti29,
Vachal19, Goldzweig31, Chen32, Williams33,
Fu34, Peek-Asa17, Neyens39, Yang52,
UNSW Sydney51 |
Age group |
14-19, 20-24 |
||
|
3 |
Otmar Bock35, Dalal36, Gershon37,
Buckley38, McDonald41, Sunanda42, Peek-Asa17,
Neyens39, Yang51, Zhang53, UNSW Sydney51 |
Contributing factors |
Aggressive/impaired driving, cause not known, defect in road
condition, drunk driver, fault of young driver, fault of the other driver,
others |
||
|
4 |
Shope21, Adanu16, Chen32,
Williams33, Fu34, UNSW Sydney51, AP News50 |
Gender |
Male, female |
||
|
Road characteristic |
5 |
Abdel-At11 |
Road surface condition |
Muddy, slippery, good conditions |
|
|
6 |
Duddu12 |
Road configuration |
Good visibility, poor visibility |
||
|
7 |
Duddu12 |
Pavement |
Exists, does not exist |
||
|
8 |
Oviedo-Trespalacios18, Duddu12, Yang52, UNICEF49, AP News50 Sunanda42, Peek-Asa et17, Neyens39 |
Maximum allowed road speed |
Mandated speed limits these studies used : |
||
|
50 km/h, 60 km/h, 70 km/h, 80 km/h, 90 km/h, 100 km/h |
|||||
|
|
|||||
|
|
9 |
Peek-Asa17, Vachal19, Das20,
McDonald41, |
Number of lanes on the road (in any direction) |
1, 2, 4, 6, more than 6 |
|
|
Weather characteristics |
10 |
Abdel-At11, Simons-Morton44, S. T. Doherty43,
UNSW50 |
Weather conditions |
Rain, snow, fog/smoke, typical weather conditions |
|
|
Date/time characteristics |
11 |
Dissanayake13, Wang14, Sunanda42,
Rice et15, Adanu16, Peek-Asa17 |
Day/night |
Day, night |
|
|
12 |
Simons-Morton44 S. T. Doherty43, UNICEF49 |
Type of day |
Normal, pre-festive, festive |
Broadly speaking, accident severity prediction models can be categorized into two groups: statistical learning and machine learning. Among these, statistical learning models have been widely employed by previous researchers. For example, Li4 employed the support vector machine (SVM) model and the ordered probit (OP) model to analyze injury severity, revealing that the SVM model exhibited superior accuracy. Yu and Abdel-Aty5 employed a classification and regression tree (CART) model to identify key explanatory variables. Using different kernel functions, these variables were then employed to compare Bayesian logistic regression and SVM models. The SVM model with a radial-basis kernel function outperformed the logistic regression model, as evaluated using ROC curves. Notably, the study highlighted the importance of reducing the variable space prior to model estimation. In a study by Chen6, SVM models were used to predict injury severity in drivers involved in rollover crashes. At the initial stage, a CART model was used to identify significant variables. Subsequently, the authors used this set of variables as an input to the SVM models, demonstrating that these models perform reasonably well with a polynomial kernel, surpassing the Gaussian radial-basis kernel model. Alkheder, et al.7 compared an artificial neural network (ANN) algorithm with an ordered probit model for the task of predicting accident severity. The authors enhanced the performance of the ANN model by utilizing a k-means algorithm to group the dataset into three distinct clusters. Their findings revealed an accuracy of 74% for the ANN model, relative to an accuracy of 59% for the ordered probit model.
In a comparative study, AlMamlook, et al.8 assessed the performance of various machine learning algorithms in forecasting the severity of road traffic accidents. Their results indicated that the Random Forest algorithm achieved the best performance (75% accuracy), although the remaining algorithms performed similarly: Logistic Regression achieved 74% accuracy, Naïve Bayes 73% and AdaBoost 74%. This paper is organized as follows: Section 1 positions the study and outlines the research gap and objectives; Section 2 describes the end-to-end workflow (data ingestion, preprocessing, feature selection, modeling and validation); Section 3 details the CBS data and access; Section 4 covers preprocessing and feature selection; Section 5 describes the models, selection criteria, hyperparameters and results; Section 6 discusses implications and limitations; Section 7 concludes.
1.3. Objectives of the
research
·To
identify features strongly correlated with injury severity in young drivers
involved in road traffic accidents, utilizing data sourced from the Central
Bureau of Statistics of Israel.
·To
formulate a machine-learning classification model that can accurately predict
the severity of injuries suffered by young drivers, while achieving a
reasonable level of precision.
2. Outline of the Research Procedure
· Data
loading and Pre-processing: Data were loaded into a
panda data frame and pre-processing actions were applied, including handling
missing values and outliers.
·Feature
selection: Various feature selection
algorithms were applied to identify the most predictive features.
·Training
and prediction: Machine learning algorithms
were developed to classify injury severity.
· Evaluation:
Algorithms were evaluated based on accuracy, precision, recall and F1 score.
Metrics
(for each class c): Accuracy = (TP+TN)/(TP+FP+TN+FN); Precision_c =
TP_c/(TP_c+FP_c); Recall_c = TP_c/(TP_c+FN_c); F1_c =
2·(Precision_c·Recall_c)/(Precision_c+Recall_c). Macro-F1 averages F1_c over
classes
· Hyperparameter
tuning: GridSearchCV was used to
enhance the accuracy of the selected algorithm.This research applies
sequence of actions for constructing and assessing the machine-learning
classification models is presented in (Figure 3). The fundamental
elements of these steps are outlined below46:
·Importing
data to the relational database: The initial phase involves the importation of CSV files
containing unprocessed data regarding attributes of road traffic accidents into
a relational database. These datasets are sourced from the Israel Central
Bureau of Statistics. The constructed MS SQL server relational database
comprises three tables: “Accident,” “Injured Person,” and “Vehicle.” Each table
incorporates a column entitled “Accident ID,” facilitating the examination of
data from all three tables through a unified logical SQL view. Additionally,
stringent data integration protocols are enforced to verify the soundness of
the input data.
· Data
loading and pre-processing:
The second step loads data from the MS SQL server database into a panda data
frame, realized within the Jupyter notebook development environment using
Python programming. Subsequently, the panda data frame becomes instrumental in
refining and pre-processing the imported data. Furthermore, recognizing the
need for uniform numeric ranges in machine learning methodologies, the standard
scaler transform technique is applied to normalize the numeric values of the
data.
· Feature
selection:
In the third stage, feature selection algorithms are applied to the dataset.
The purpose of this step is to uncover the attributes that are most important
for predicting injury severity and should, therefore, serve as inputs to the
candidate machine-learning algorithms.
·Training
and prediction:
The fourth phase consists of training and developing each of the potential
machine learning algorithms. These algorithms classify injury severity for
young drivers embroiled in traffic accidents.
· Evaluation: The fifth step entails a
meticulous assessment of the performance of each algorithm based on four
metrics-accuracy, precision, recall and F1 score.
·Hyperparameter
tuning and validation:
In the final step, a hyperparameter tuning procedure is applied to enhance the
accuracy of the selected algorithm.

Figure 3: Flowchart of the
procedure for selecting the optimal machine learning algorithm.
3. Importing Data
This section describes the
initial step of the process in greater detail. The input data originated from
the Central Bureau of Statistics of Israel and encompassed records of 37,499
traffic accidents involving young drivers spanning from 2009 to 2019. Within
this dataset, 396 accidents were fatal, while 37,103 incidents led to non-fatal
injuries for young drivers. For each entry, a total of 59 variables were
present, capturing information such as the unique crash ID, the date and time
of the crash, driver attributes (including gender and age group), accident
location and details about the road.
The Israeli Central Bureau of Statistics administers the nation’s traffic accident data through a compilation of 14 CSV files, each with a distinct structure. The entire set of files was imported into an MS SQL server relational database to facilitate data retrieval and ensure the integrity of the incoming data. This importation process was facilitated using the MS SQL server’s SSIS data tools. Within this system, three domain tables were built46: Accident, Injured Person and Vehicle. The latter two tables contained an Accident ID field, allowing their data to be synchronized with the data in the Accident table. Moreover, logical views were formulated using the shared Accident ID field to amalgamate data from all domain tables. This integration resulted in a comprehensive representation of data from all tables within a singular frame. Rigorous data integration protocols were invoked to ensure data integrity. These protocols encompassed the assignment of appropriate column data types (e.g., integer, float, date), the establishment of primary and foreign indexes and the application of stringent constraints such as unique indexes and default values. Furthermore, the Vehicle and Injured Person tables were equipped with foreign key constraints. (Figure 4) presents the variables encapsulated within each of the domain tables stored in the database.

Figure 4: Variables stored in each
domain table within the database.
The Accident table encompassed information such as the date and time of the accident, the type of road (urban junction, non-urban junction) and the geographical coordinates of the accident site. In parallel, the Vehicle table contained data pertaining to the vehicle(s) implicated in the traffic accident, e.g., the vehicle type (regular, army, police, etc.), engine capacity, vehicle status (rented, stolen, etc.) and vehicle weight. Finally, the Injured Person table housed data relating to the individuals affected by the accident, specifically only the driver. This category included characteristics such as the severity of the sustained injuries (uninjured, fatal, serious, slight), gender and age group.
·Source and coverage: Data were obtained from the
Israel Central Bureau of Statistics (CBS) covering traffic accidents 2009-2019.
The dataset contains N = 37,499 accident records linked across Accident,
Injured Person and Vehicle tables.
·Variables: The raw dataset had 59
variables. After preprocessing and feature selection, 20 were retained for
analysis. Exclusions (see Appendix A) were due to missingness >50%, low
variance or collinearity.
·Target and class balance: Fatal = 512 (1.37%), Serious
= 4,186 (11.17%), Slight = 32,801 (87.46%).
Missing data: Numerical variables
imputed by median, categorical by mode. StandardScaler applied to numerical
features.
·Data availability: CBS microdata requires
request; code and reproducible synthetic example provided in Supplementary.
4. Data Preparation and Feature Selection
This section elaborates on the second and
third phases of the procedure. Data from the MS SQL server’s logical view were
funneled into the panda data frame object to facilitate various pre-processing
actions46. The following procedures were then
applied:
· Blank or
NULL values for a specific feature were substituted with an appropriate average
value (mean or median) for the dataset.
· Outliers
were detected manually (by scrutinizing the data) and subsequently eliminated.
The next step was to reduce the size of the
variable space to be used as an input to the machine learning algorithms. This
was achieved via an array of feature selection methods, each of which is
described below.
4.1. Variance threshold algorithm
In this approach, features were only
included if their variance exceeded 0.5. The premise for this algorithm is that
features with low variance offer limited modeling utility, with the
recommendation being to adopt a threshold value approaching zero30. Using this method, 27 features (as
detailed in Table set 2) were identified as the most likely candidates for
demonstrating a robust correlation with the severity of injuries among young
drivers.
(Table 2).
Features selected using the variance threshold algorithm.
|
# |
Variable |
Values |
|
Driver's
Characteristics |
||
|
1 |
Gender |
Male, Female |
|
2 |
Ethnic group |
Jewish, Non-Jewish,
Not specified or other |
|
3 |
Age group |
14-19, 20-24 |
|
4 |
Population setting |
Rural background,
Urban upbringing |
|
Road
characteristics |
||
|
5 |
Road category |
Highway, major
district road, village road, other road, unknown |
|
6 |
Maximum allowed speed |
50 km/h, 60 km/h,
70 km/h, 80 km/h, 90 km/h, 100 km/h |
|
7 |
Traffic control
|
No control, working
traffic light, failed traffic light, blinking yellow, stop sign, priority
sign, not specified |
|
8 |
Road width |
Up to 5 m, 5 to 7
m, 7 to 10 m, 10 to 14 m, over 14 m |
|
9 |
Number of lanes on the road (in any
direction) |
1, 2, 4, 6, more
than 6 |
|
10 |
Road signpost |
Defective/missing
signage, no signage required, signage intact, unknown |
|
11 |
Road surface conditions |
Dry, wet from
water, wet from slippery material, covered with mud, covered with sand, not
specified |
|
12 |
Type of road |
One-way road,
two-way road with separation, two-way road without separation, not specified |
|
13 |
Shoulders of the road |
Paved shoulders,
low shoulders, rough road (no tarmac or hard shoulder) |
|
14 |
Shape of road |
Entrance to an
interchange, exit from an interchange, parking lot, steep slope, sharp curve,
railroad junction, bus stop, public transport route, other |
|
15 |
Illumination on the road |
Daylight, night
without illumination, night with illumination |
|
Accident location
characteristics |
||
|
16 |
Area |
Central, north,
south |
|
17 |
Location of the
accident |
Urban at a
junction, urban not at an intersection, non-urban at an intersection,
non-urban and not at a crossroads |
|
18 |
District |
Jerusalem, the
north, Haifa, the center, Tel Aviv, the south, Judea and Samaria, Gaza
envelope |
|
Date/time
characteristics |
||
|
19 |
Day of the week |
Sunday, Monday,
Tuesday, Wednesday, Thursday, Friday, Saturday |
|
20 |
Day/night |
Day, night |
|
21 |
Period of the day |
Morning peak,
off-peak, afternoon peak, evening/night |
|
19 |
Day of the week |
Sunday, Monday,
Tuesday, Wednesday, Thursday, Friday, Saturday |
|
Vehicle
characteristics |
||
|
23 |
Vehicle type |
Bicycle, motorcycle
up to 50 cc, motorcycle 51 to 250 cc, motorcycle 251 to 500 cc, motorcycle
>501 cc, car, bus, cab, work vehicle, tractor, train, minibus, freight
(>34.0 tons total weight) |
|
24 |
Vehicle weight
(tons) |
Less than 1.9,
2.0-2.9, 3.0-3.5, 3.6-4.0, 4.1-5.9, 6.0-7.9, 8.0-9.9, 10.0-12.0, 12.1-12.9,
13.0-15.9, 16.0-19.0, 19.1-25.9, 26.0-30.0, 30.1-32.0, 32.1-33.9, 34.0-40.0,
40.1-56.0, ³56.1 |
|
25 |
Use of safety
accessories |
Fastened seat belt, wore a protective
helmet (motorcycle only), sat in a child seat
(injured child only), did not use safety measures |
|
26 |
Vehicle status |
Regular, stolen,
rented, transport student, transporting children |
|
Weather
characteristics |
||
|
27 |
Weather conditions |
Clear, rainy, hot,
foggy, not specified |
4.2. SelectKBest algorithm
In this technique, a
designated function (e.g., chi-squared or other relevant statistical test)
assigns a score to each feature. Subsequently, the k highest scoring features are retained [30]. This approach aims
to identify the k most
informative features from the initial set. The value of k needs to be greater than 0 and cannot exceed the total number
of features. For this study, a value of 20 was employed. The ensuing set of
features was as follows: vehicle weight (with reference to the vehicle of the
young driver), vehicle type (vehicle of the young driver), gender, age group,
ethnic group, traffic control, use of safety accessories, road width, behavioral
factors, day/night, road surface conditions, road shape, road signpost,
population setting, maximum allowed speed, period of day, weather conditions,
type of day, vehicle status and shoulders of road.
4.3. SelectPercentile
algorithm
The SelectPercentile approach
is similar to SelectKBest, but instead of identifying the k most effective features, it retains
a certain percentage of the features (again, based on their scores). The
SelectPercentile algorithm returned the following set of features: road surface
conditions, traffic control, maximum allowed speed, contributing factors,
gender, age group, number of lanes on the road, road signpost, use of safety
accessories, illumination on the road, vehicle weight, vehicle status, day of
the week, location of the accident, district, driver’s ethnic group, type of
road and road category.
4.4. Sequential feature
selector algorithm
This algorithm employs a
greedy approach to add (forward selection) or eliminate (backward selection)
variables when constructing a subset of features. At each step, the algorithm
strategically picks the best feature for addition or removal based on a cross-validation
score produced by an estimator46. When employed in unsupervised
learning, this method exclusively considers the input features (X) without
reference to the desired outputs (y) [30]. Within this study, the sequential
feature selector algorithm identified the following features: accident
location, driver’s age group and gender, road signpost, day/night, road illumination,
period of the day, district, number of road lanes, road shape, road width, road
surface conditions, vehicle type, vehicle weight, maximum allowed speed,
driver’s ethnic group, weather conditions and road shoulders.
To amalgamate the outcomes of the aforementioned algorithms, we selected the 20 features with the highest occurrence (i.e., that appeared most often across the four models). This culminated in the definitive list presented in (Table 3), which served as the input data for the machine-learning classification algorithms assessed in this study.
Table 3:
List of features employed as inputs to the classification algorithms.
|
# |
Variable |
Values |
|
Driver's Characteristics |
||
|
1 |
Gender |
Male, female |
|
2 |
Age group |
14-19, 20-24 |
|
3 |
Population setting |
Rural background, urban upbringing |
|
4 |
Ethnic group |
Jewish, non-Jewish, not specified or other |
|
# |
Variable |
Values |
|
Road characteristics |
||
|
5 |
Road surface conditions |
Dry, wet from water, wet from slippery material,
covered with mud, covered with sand, not specified |
|
6 |
Traffic control |
No control, working traffic light, failed traffic
light, blinking yellow, stop sign, priority sign, not specified |
|
7 |
Maximum allowed speed |
50 km/h, 60 km/h, 70 km/h, 80 km/h, 90 km/h, 100
km/h |
|
8 |
Contributing factors |
Aggressive/impaired driving, cause not known,
defect in road condition, drunk driver, fault of young driver, fault of the
other driver, others |
|
9 |
Number of lanes on the road (in any direction) |
1, 2, 4, 6, more than 6 |
|
10 |
Road signpost |
Defective/missing signage, signage intact, a
signpost is required (lacking, not misplaced or faulty), unknown |
|
11 |
Type of road |
One-way road, two-way road with separation,
two-way road without separation, not specified |
|
12 |
Use of safety accessories |
Fastened seat belt, wore a protective helmet
(motorcycle only), sat in a child seat (injured child only), did not use
safety measures |
|
13 |
Illumination on the road |
Daylight, night without illumination, night with
illumination |
|
14 |
Road category |
Highway, major district road, village road, other
road, unknown |
|
Accident location
characteristics |
||
|
15 |
Location of the accident |
Urban at a junction, urban not at an
intersection, non-urban at an intersection, non-urban and not at a crossroads |
|
16 |
District |
Jerusalem, the north, Haifa, the center, Tel
Aviv, the south, Judea and Samaria, Gaza envelope |
|
Vehicle characteristics |
||
|
17 |
Vehicle type |
Bicycle, motorcycle up to 50 cc, motorcycle 51 to
250 cc, motorcycle 251 to 500 cc, motorcycle >501 cc, car, bus, cab, work
vehicle, tractor, train, minibus, freight (>34.0 tons total weight) |
|
18 |
Vehicle weight (tons) |
Less than 1.9, 2.0-2.9, 3.0-3.5, 3.6-4.0,
4.1-5.9, 6.0-7.9, 8.0-9.9, 10.0-12.0, 12.1-12.9, 13.0-15.9, 16.0-19.0,
19.1-25.9, 26.0-30.0, 30.1-32.0, 32.1-33.9, 34.0-40.0, 40.1-56.0, ³ 56.1 |
|
Date/time characteristics |
||
|
19 |
Day/night |
Day, night |
|
Weather
characteristics |
||
|
20 |
Weather conditions |
Clear, rainy, hot, foggy, not specified |
·Precision denotes the ratio between the correctly predicted instances for a particular class and all the instances predicted to belong to that class, again averaged across the three classes.
·Recall indicates the number of accurately predicted instances of a specific class as a proportion of the actual instances of that class.
· F1 score represents a weighted harmonic mean of precision and recall, providing a balance between these two metrics.
·Support denotes the number of actual instances of a specific class (e.g., fatal cases). Disparities in support could potentially indicate imbalances in the dataset, requiring rebalancing or sampling techniques.
The scikit-learn package facilitated the construction of machine-learning models and the generation of classification reports. The data were separated into two distinct sets: one for training (80% of the dataset) and another for testing (20%). All data manipulations were confined to the training dataset, while the testing dataset was reserved for evaluation, leading to the creation of the classification reports. The resultant performance metrics are presented in (Table 4).
Table 4: Accuracy, precision, recall and F1 scores for the candidate classification algorithms.
|
# |
Classification
algorithm name |
Accuracy |
Precision |
Recall |
F1 score |
|
1 |
Logistic Regression |
0.95000 |
0.95000 |
0.95000 |
0.95000 |
|
2 |
Logistic Regression CV |
0.95000 |
0.95000 |
0.95000 |
0.95000 |
|
3 |
Gradient Boosting Classifier |
0.95000 |
0.95000 |
0.95000 |
0.95000 |
|
4 |
SVM |
0.95000 |
0.95000 |
0.95000 |
0.95000 |
|
5 |
Linear SVC |
0.95000 |
0.95000 |
0.95000 |
0.95000 |
|
6 |
Naive
Bayes Classifiers |
0.90000 |
0.91000 |
0.90000 |
0.90000 |
|
7 |
Gaussian Naive Bayes |
0.91000 |
0.91000 |
0.92000 |
0.91000 |
|
8 |
Ridge Classifier |
0.95000 |
0.95000 |
0.95000 |
0.95000 |
|
9 |
Ridge Classifier CV |
0.95000 |
0.95000 |
0.95000 |
0.95000 |
|
10 |
Decision Tree Classifier
|
0.95000 |
0.95000 |
0.95000 |
0.95000 |
|
11 |
Random Forest Classifier |
0.97000 |
0.97000 |
0.97000 |
0.97000 |
|
12 |
Extra Tree Classifier |
0.98453 |
0.98000 |
0.98000 |
0.9321 |
|
13 |
Perceptron Algorithm |
0.94000 |
0.94000 |
0.94000 |
0.94000 |
|
14 |
K-nearest Neighbors |
0.94000 |
0.94000 |
0.94000 |
0.94000 |
|
15 |
XGBoost |
0.96000 |
0.97000 |
0.97000 |
0.96000 |
|
16 |
Bagging classifier |
0.96000 |
0.96000 |
0.96000 |
0.96000 |
Based on the metrics presented in (Table 4), the extra tree classifier was identified
as the best machine-learning approach for anticipating the extent of injuries
faced by young drivers embroiled in road traffic incidents within Israel. To
further improve the extra tree classifier, an algorithm from the scikit-learn
package30 called GridSearchCV was implemented. This
algorithm allows the user to ascertain the optimal hyperparameter values for a
given classifier. The ideal number of trees for the extra tree classifier,
noting that the search domain ranged from 10 to 500, was found to be 50.
Subsequently, GridSearchCV analyzed the number of samples needed at a decision
tree junction before introducing another division in the tree (a parameter
denoted as ‘min_samples_split’). Values of min_samples_split from 2 to 15 were
tested and it was determined that the value of 10 samples resulted in the
highest accuracy. These parameter adjustments in the extra tree classifier
effectively elevated its accuracy to 0.98453, a notable enhancement from the
prior score of 0.98037.
We evaluated Logistic
Regression, K-Nearest Neighbors, Decision Tree, Random Forest, Extra Trees,
Gradient Boosting (XGBoost), Support Vector Machine and Naïve Bayes.
Hyperparameters were optimized by GridSearchCV/RandomizedSearchCV with
stratified 5-fold CV. Hyperparameter grids are shown in Supplementary Table S2.
Class imbalance handled with class_weight and SMOTE experiments. Python 3.9,
scikit-learn 1.2+, XGBoost 1.6+ used (see Supplementary for exact versions).
The primary objective of this study revolved around identifying and constructing the most precise model possible for predicting the extent of injuries in young drivers implicated in vehicle accidents in Israel. Through our investigation, we determined that the extra tree classifier, belonging to the decision-tree algorithm family, demonstrated the best classification performance. In previous studies with a similar context, researchers have often leaned toward the utilization of the logistic regression algorithm5,8,10. Given that the extra tree classifier is a relatively novel algorithm, it is plausible that researchers have yet to accumulate experience in its application to the specific problem domain addressed in this study. The merit of employing tree-based learning algorithms resides in their capacity to be trained on extensive datasets and to accommodate both quantitative and qualitative input variables. Moreover, tree-based models are adept at handling redundant and highly correlated variables, thus mitigating overfitting risks encountered in alternative learning algorithms. The simplicity of trees translates to a minimal requirement for parameter tuning during model training, rendering them resilient in scenarios involving outliers or missing data values. When the variance between the explanatory and noise variables is high, logistic regression consistently achieves superior overall accuracy to forest classifiers. Specifically, forest classifiers outperform logistic regression in terms of true positive rates and they also show a lower false positive rate when the noise variables are large45.
The findings validate the general conclusions gleaned from the literature review concerning the importance of factors such as the road surface, signposts, road illumination, number of lanes, road shape, vehicle weight, road surface conditions, accident location and maximum allowed speed. Other pertinent factors include the age of the young driver, weather conditions, the setting (rural vs. urban roads), the amount of driving experience and the gender of the young driver-all of which have been highlighted as significant variables in prior research15,16,18-20,22-24,27,30. Notably, however, the present study failed to uncover a substantial influence of alcohol consumption on the part of the driver, in contrast to the established significance of this variable in driver fatality studies carried out in the United States and European countries25,26.
6.2. Constraints and areas
for future investigation
This
study did not explore the capabilities of various ensemble classifiers, such as
the voting classifier, stacking classifier, gradient boosting classifier,
passive-aggressive classifier, nearest centroid classifier, perceptron and
histogram-based gradient boosting classifier40. Ensemble methods are
designed to enhance generalization and resilience relative to individual
estimators. Additionally, this research did not employ hybrid machine-learning
models. Such models advance the field, integrating diverse computations,
methods or processes from similar or disparate data domains or application
areas to enhance their mutual performance.
Notably, the authors had previously published papers that developed machine-learning-based models to diminish the severity of pedestrian and bicyclist injuries46,47 in road traffic incidents. Hence, similarities between the studies might prevail regarding the models used, data source, software and technical terms. Nevertheless, the current paper makes a worthwhile contribution by developing machine-learning models to classify the severity of road traffic injuries among young drivers. Metrics reported with 4 significant digits. Extra Trees achieved accuracy = 0.98453, macro F1 = 0.9321. Stability assessed across 10 seeds. McNemar's test compared top models. Interpretability through permutation importance and SHAP plots (Figure 3). Ablation study confirmed robustness when removing top-3 features.
7. Conclusion
8.
Author Contributions
Conceptualization, Slava Birfir;
methodology, Slava Birfir; software, Slava Birfir; validation, Slava Birfir, Amir
Elalouf and Tova
Rosenbloom; formal analysis,
Slava Birfir; investigation, Slava Birfir; resources, Slava Birfir; data
curation, Amir Elalouf
and Tova Rosenbloom;
writing—original draft preparation, Slava Birfir; writing-review and editing, Amir
Elalouf and Tova
Rosenbloom; visualization, Slava
Birfir; supervision, Amir Elalouf
and Tova Rosenbloom;
project administration, Slava Birfir. All authors have read and agreed to the
published version of the manuscript.
9. Funding
The authors listed below affirm that they
have no affiliations with or engagement in any organization or entity with
financial interests (including honoraria, educational grants, participation in
speakers' bureaus, membership, employment, consultancies, stock ownership,
equity interests, expert testimony or patent-licensing arrangements) or
non-financial interests (such as personal or professional relationships,
affiliations, knowledge or beliefs) related to the subject matter or materials
discussed in this manuscript.
10.
Conflicts of Interest
The authors whose names are listed
immediately below certify that they have NO affiliations with or involvement in
any organization or entity with any financial interest (such as honoraria;
educational grants; participation in speakers’ bureaus; membership, employment,
consultancies, stock ownership or other equity interest; and expert testimony
or patent-licensing arrangements) or non-financial interest (such as personal
or professional relationships, affiliations, knowledge or beliefs) in the
subject matter or materials discussed in this manuscript.
11. Data Availability Statement
The data we used in our article is
provided by the Central Bureau of Statistics of Israel. According to their
policy, I am unable to include any data directly in my article. However, those
interested in accessing this data may contact the Central Bureau of Statistics
by emailing [email protected] or by filling out the request form
available at https://www.cbs.gov.il/he/subjects/Pages/%D7%AA%D7%97%D7%91%D7%95%D7%A8%D7%94.aspx. The article's data is not publicly
available but can be accessed upon request. Please refer to the attached
document, Confirmation Regarding Data Availability
Restrictions.doc,
for further details.
12. References
- https://crashstats.nhtsa.dot.gov/Api/Public/ViewPublication/812981
- https://crashstats.nhtsa.dot.gov/Api/Public/ViewPublication/811402
- https://webappa.cdc.gov/sasweb/ncipc/leadcaus10_us.html
- Li Z, Liu P, Wang W, et al. Using
support vector machine models for crash injury severity analysis. Accid Anal
Prev, 2012;45: 478-486.
- Yu R, Abdel-Aty M. Utilizing
support vector machine in real-time crash risk evaluation. Accid Anal Prev,
2013;51: 252-259.
- Chen C, Zhang G, Qian Z, et
al. Investigating driver injury severity patterns in rollover crashes using
support vector machine models. Accid Anal Prev, 2016;90: 128-139.
- Alkheder S, Taamneh M, Taamneh S. Severity
prediction of traffic accident using an artificial neural network. J Forecast,
2017;36: 100-108.
- AlMamlook
RE, Kwayu KM, Alkasisbeh MR, et al. Comparison of machine learning algorithms
for predicting traffc accident severity. IEEE Jordan International Joint
Conference on Electrical Engineering and Information Technology (JEEIT), 2019:
272-276.
- https://learn.microsoft.com/en-us/sql/relational-databases/databases/databases
- Li P, Abdel-Aty M, Yuan J. Real-time
crash risk prediction on arterials based on LSTM-CNN. Accid Anal Prev,
2020;135: 105371.
- Abdel-Aty M, Ekram AA, Huang
H, et al. A study on crashes related to visibility obstruction due to fog and
smoke. Accid Anal Prev, 2011;43: 1730-1737.
- Duddu VR, Kukkapalli VM, Pulugurtha SS.
Crash risk factors associated with injury severity of teen drivers IATSS Res,
2019;43: 37-43.
- Dissanayake S, Amarasingha N. Safety
experience of young drivers in comparison to experienced drivers T DI Congr.
2014 Planes, Trains, Automob. Proc 2nd Transp Dev Inst Congr, 2014: 344-355.
- Wang J, Zhang G. Modeling and examining
the teenage and adult freeway crash risks and injury severities in Washington
state. J Transp Saf Secur, 2011;3: 207-221.
- Rice TM, Peek-Asa C, Kraus JF.
Nighttime driving, passenger transport and injury crash rates of young drivers.
Inj Prev, 2003;9: 245-250.
- Adanu EK, Penmetsa P, Jones S, et
al. Gendered analysis of fatal crashes among young drivers in Alabama, USA,
Safety, 2018;4: 8-13.
- Peek-Asa C, Britton C, Young
T, et al. Teenage driver crash incidence and factors influencing crash injury
by rurality. J Safety Res, 2010;41: 487-492.
- Oviedo-Trespalacios O, Scott-Parker B.
Transcultural validation and reliability of the Spanish version of the
behaviour of young novice drivers scale (BYNDS) in a Colombian young driver
population. Transp Res Part F Traffic Psychol Behav, 2017;49: 188-204.
- Vachal K, Faculty R, Malchose
D. What can we learn about North Dakota’s youngest drivers from their crashes?
Accid Anal Prev, 2009;41: 617-623.
- Das S, Minjares-Kyle L, Wu L,
et al. Understanding crash potential associated with teen driving: survey
analysis using multivariate graphical method. J Safety Res, 2019;70: 213-222.
- Shope JT, Bingham CR. Teen
Driving. Motor-Vehicle Crashes and Factors That Contribute. Am J Prev Med,
2008;35.
- McCartt T, Mayhew DR, Braitman
KA, et al. Effects of age and experience on young driver crashes: review of
recent literature. Traffic Inj Prev, 2009;10: 209-219.
- Lewis-Evans B. Crash
involvement during the different phases of the New Zealand Graduated Driver
Licensing System (GDLS). J Safety Res, 2010;41: 359-365.
- Mayhew DR, Simpson HM, Pak A.
Changes in collision rates among novice drivers during the first months of
driving. Accid Anal Prev, 2003;35: 683-691.
- Mayhew DR, Donelson AC,
Beirness DJ, et al. Youth, alcohol and relative risk of crash involvement.
Accid Anal Prev, 1986;18: 273-287.
- Peck RC, Gebers MA, Voas RB,
et al. The relationship between blood alcohol concentration (BAC), age and
crash risk. J Safety Res, 2008;39: 311-319.
- Fell JC, Fisher DA,
Voas RB, et al. The relationship of underage drinking laws to reductions in
drinking drivers in fatal crashes in the United States. Accid Anal Prev,
2008;40: 1430-1440.
- Gonzales MM, Dickinson LM,
DiGuiseppi C, et al. Student drivers: a study of fatal motor vehicle crashes
involving 16-year-old drivers. Ann Emerg Med, 2005;45: 140-146.
- Paleti R, Eluru N, Bhat CR.
Examining the influence of aggressive driving behavior on driver injury
severity in traffic crashes. Accid Anal Prev, 2010;42: 1839-1854.
- https://scikit-learn.org/stable/modules/feature_selection.html
- Goldzweig IA, Levine RS,
Schlundt D, et al. Improving seat belt use among teen drivers: findings from a
service-learning approach. Accid Anal Prev, 2013;59: 71-75.
- Chen LH, Baker SP, Braver ER,
et al. Carrying passengers as a risk factor for crashes fatal to 16- and 17-
year-old drivers. J Am Med Assoc, 2000;283: 1578-1582.
- Williams AF, Wells JAK. Deaths
of teenagers as motor-vehicle passengers. J Safety Res, 1995;26: 161-167.
- Fu H, Wilmot CG. Effect of
passenger age and gender on fatal crash risks of young drivers. Transp Res Rec,
2008;2007: 33-40.
- Bock O. Distracting tasks have
persisting effects on young and older drivers’ braking performance. Accident
Analysis & Prevention, 2021;161: 106363.
- Dalal K, Lin Z,
Gifford M, et al. Economics of global burden of road traffic injuries and their
relationship with health system variables. International Journal of Preventive
Medicine, 2013;4: 1442-1450.
- Gershon P. Visual Inattention
and Crash Risk Among Teenage Drivers? American Journal of Preventive Medicine,
2019;56: 494-500.
- Buckley L, Chapman RL, Sheehan
M. Young driver distraction: state of the evidence and directions for behavior
change programs. J Adolesc Heal, 2014;54: 16-21.
- Neyens DM, Boyle LN. The
effect of distractions on the crash types of teenage drivers. Accid Anal Prev,
2007;39: 206-212.
- Freund
Y, Schapire R. Experiments with a new boosting algorithm. In Machine Learning:
Proceedings of the Thirteenth International Conference (ICML ’96); Morgan
Kaufmann Publishers Inc.: Bari, Italy. 1996: 148-156.
- McDonald C, Curry AE, Kandadai
V, et al. Comparison of teen and adult driver crash scenarios in a nationally
representative sample of serious crashes, Accid Anal Prev, 2014;72: 302-308.
- Dissanayake S. Comparison of severity
affecting factors between young and older drivers involved in single vehicle
crashes. IATSS Res, 2004;28: 48-54.
- Doherty ST andrey JC, MacGregor
C. The situational risks of young drivers: the influence of passengers, time of
day and day of week on accident rates. Accid Anal Prev, 1998;30: 45-52.
- Simons-Morton BG, Hartos JL.
How well do parents manage young driver crash risks? J Safety Res, 2003;34:
91-97.
- Kirasich,
Smith T, Sadler B. Random Forest vs Logistic Regression: Binary Classification
for Heterogeneous Datasets Random Forest vs Logistic Regression: Binary
Classification for Heterogeneous Datasets, 2018;1.
- Birfir
S, Elalouf A, Resenbloom T. Building machine-learning models for reducing the
severity of bicyclist road traffic injuries. Tranpostation engineering,
2023;12.
- Elalouf
A, Birfir S, Rosenbloom T. Developing machine-learning-based models to
diminish the severity of injuries sustained by pedestrians in road traffic
incidents, Heliyon, 2023;9: 21371.
- https://www.unicef.org/reports/protecting-young-lives
- https://apnews.com/article/young-drivers-fatalities-statistics-report-f3ce1bab8d8f525ffc2cbe4a77f94ca0
- https://www.sciencedaily.com/releases/2022/06/220629202950.htm
- Zhang Z, Xu N, Liu J, et al.
Exploring spatial heterogeneity in factors associated with injury severity in
speeding-related crashes: An integrated machine learning and spatial modeling
approach. Accident Analysis & Prevention, 2024;206: 107697.
- Yang C, Liu J, Zhang Z, et al.
A machine learning approach to understanding the road and traffic environments
of crashes involving driver distraction and inattention (DDI) on rural
multilane highways. Journal of Safety Research, 2025;92: 14-26.
Disclaimer/Publisher’s Note: The statements, opinions and data contained in all publications are solely those of the individual author(s) and contributor(s) and not of MDPI and/or the editor(s). MDPI and/or the editor(s) disclaim responsibility for any injury to people or property resulting from any ideas, methods, instructions or products referred to in the content.
Appendix A: Feature Selection Summary