Micro frontend Client Application Observability and Operational Telemetry Approaches and Patterns
Abstract
Micro-frontends extend the
concept of micro-services to the world of UI. The idea behind building
applications as Micro Frontend is to develop the experience as a composition of
features which are owned and developed completely isolated and by independent
teams. These micro-experiences are then strung together either at run-time or
build-time to deliver a single cohesive application experience to the end user.
In IT and cloud computing,
observability is the ability to measure a system’s current state based on the
data it generates, such as logs, metrics and traces. Specific to UI
applications, this refers to gaining a full understanding of how the
application operates in real-time when a consumer interacts with it.
Telemetry is often used to
refer to the process of collecting and transmitting data from systems, such as
logs, metrics and traces. Telemetry data can be used to understand how a system
performs and behaves. So, while Telemetry is the collection of data from
systems, observability is the process of analyzing that data to understand how
a system works. Operational Telemetry refers to the specific data collection
that is required by application support and engineering teams looking to debug
and triage or ascertain application performance in a development or production
environment.
Traditional application
development has some well-defined options to solution observability and
operational telemetry. This paper will dive into a high-level understanding of
the options for telemetry, observability and specific intricacies of building a
holistic observability solution for micro-frontends.
Keywords: Telemetry, Observability, Web
development, Micro-frontend, Composable Architecture
1. Introduction
Observability is how
different stakeholders of a software understand its health. In control theory,
observability is defined specifically geared towards engineers, referring to
how engineers can infer the internal states of a system from knowledge of that
system's external outputs. Overall, this provides a proactive approach to
analyse and optimize their system based on the data it generates. Most modern
systems are complex and are developed and deployed at significant scale. Often
these systems are distributed deployments and an observability platform is
crucial to keep operations manageable.
Observability platforms
provide a real-time view of the health of a system, most often from an
operational perspective. These platforms traditionally provide an overall
solution suite with ability to collect, store, analyse and visualize logs,
other metrics and if required, traces. These help engineers and other
stakeholders dive into applications and infrastructure to understand system
behaviour either to resolve issues or for better understanding the system for
optimization.
There are often different stakeholders for an application who want data
collected about application operations, activity and performance. These
stakeholders often have their specific concerns and differing requirements
based on those concerns. At a macro level, these concerns may be divided as
coming from the product, business, production operations and development teams.
The operational teams may have different concerns depending on their scope
being a tier 2 or early triage operations compared to the actual devOps or
Tier3 teams representing the application.
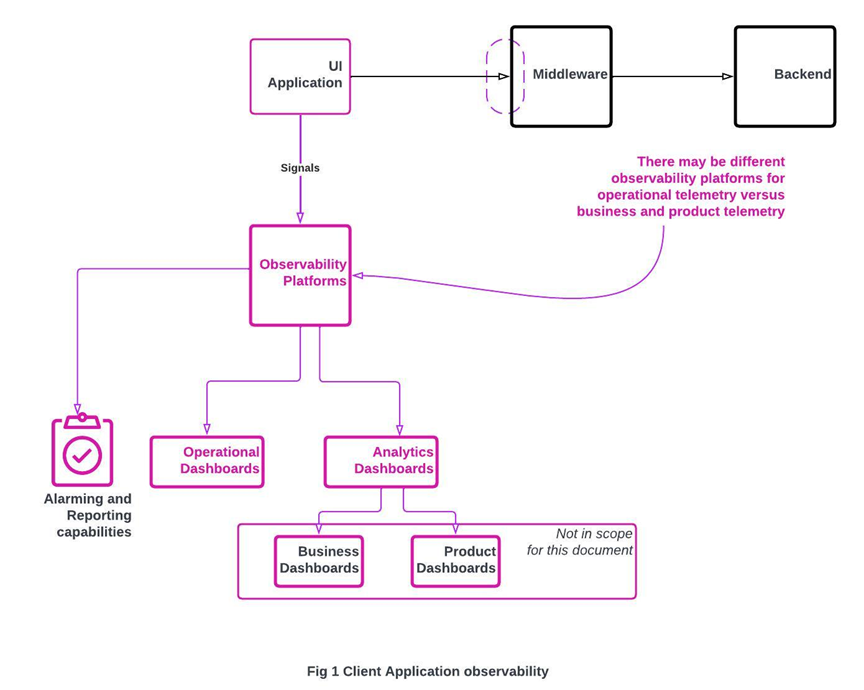
For this document, we will stick to operational observability (figure1)
and focus specifically on micro-frontend web applications. These concerns are
well documented for traditional applications and on the backend systems. Web
application telemetry is an often-overlooked topic. Micro-frontends do bring
some specific concerns into the mix which this paper will try to bubble up.
2. Considerations for
effective Observability Strategy
Observability needs vary based on type of application and its targeted
domain, uptime and availability needs, criticality etc. There is also
significant variance based on the team requesting the observability solution.
This section will go over these concerns before we dive into observability
solutions.
2.1. Complexity of UI Application: Client web apps have traditionally had
limited operational telemetry built into it with most relying heavily on their
backend server telemetry for operations. Traditional multi page apps utilize constant
chatter with their server across the page which provides ample coverage even if
the application traffic is just monitored at the client-server interfaces. With
modern development methodologies including strategies like single page
applications and apps integrating and using with native OS capabilities via
local API(s), monitoring on the server is not always enough. Additionally, the
increase in client compute and advent of complex frameworks like angular is increasing
complexity of client apps.
How does micro-frontend strategy impact this complexity? Depending on
how your micro-frontend is strung together, it is often more complex than a
regular app. There is more complexity client side which can break the
application, generally driven by conflicts between different microapps stemming
from JavaScript, styles and other dependencies and from the heightened resource
utilization.
Additionally, depending on implementation, a lot of enterprise
observability platforms don’t work out of box. As an example, for an
application implemented with multiple angular elements running side by side, a
leading APM solutions’ client monitoring suite kept identifying every angular
elements load and unload as individual apps creating significant noise and
diminishing all out of box capabilities.
2.2. Type of application
While all applications are important, certain applications have more
critical availability and resiliency needs than others driving up the need for
a monitoring solution. As an example, a banking solution may desire higher
uptime and availability than a publishing website. The nature of the
application may drive the observability needs.
2.3. Application Access and User-agents
Like complexity in the application codebase, the ways an application is
accessed may also drive complexity. An application only accessed on specific
desktop browsers is far less likely to have client-side issues than application
that is accessed over desktop, mobile and web-views etc. These different
clients that need to be supported drive up the complexity and chances of
encountering some failure permutation. WebView’s are especially tricky as
unlike let’s say a desktop chrome, which comes with a whole set of debugging
tools, capabilities when supporting triage for an app within a web-view are
significantly more limited, especially in production settings. Micro-frontends
often increase this complexity as they increase the number of modules and
codebases that come together and may fail.
2.4. Operational Support Team
requirements
Different kinds of teams may drive different requirements, operation
teams are often broken down into different Tiers. Listed below are the
different tiers and the kind of requirements they drive
- Tier 0 Support: This level generally relies on
providing automated or self-service capabilities for resolution. For client
applications, this level of support automation may include automated or
self-serve account or state reset for individual session issues or server
restarts in case of widespread outages by relying on macro signals like
traffic, performance and error rates on the site. This type of team does not
have specific requirements from client-side application monitoring.
- Tier 1 Support: This is typically the first line
of defence and again deals with basic known issues like password resets,
printer configurations and basic troubleshooting with a pre-defined MOP. This
type of team does not have specific requirements from client-side application
monitoring.
- Tier 2 Support: When a customer issue goes
beyond the skill set of a Tier 1 team member, that issue then escalates to Tier
2. Your Tier 2 team has the knowledge and skills to handle more complex
customer issues and use remote control tools. Traditionally this involves
diagnosing, triaging and isolating the issue to a specific layer of the
application and executing pre-defined MOP as provided by development or Tier3
support teams for known issues. This team may also be ‘eyes on glass’ to
dashboards or alarms and react with pre-defined MOPs. Tier2 teams often need
access to application health dashboards which may provide aggregated samples
like traffic and error rate, latency and performance etc. They also need access
to dashboards and reports with Health KPIs for various layers including the
client application to be able to diagnose and triage issues.
- Tier 3 Support: Tier 3 is usually the
highest level of technical support for the application and often includes the
engineers or developers. Tier 3 personnel are involved when advanced
troubleshooting within a particular application tier is necessary. These teams
often need detailed application logs and other client health matrices depending
on the complexity and type of application.
2.5. Levels of Monitoring
Even for web-apps, Monitoring can be at multiple levels
- Website monitoring: This focuses on accessibility and performance of a web
application from the users of the application perspective. It traditionally
involves synthetic monitoring. More on this strategy later
- Application-level monitoring: This dives into the
inner workings of the web application itself. This level tracks key performance
metrics within the application, such as render times, API response times and
user interactions, this level of monitoring helps fine-tune an application’s
performance to improve user experiences and troubleshoot functionality issues.
More details on the kind of data that can be captured will be detailed in
subsequent sections.
- Server (OS) level monitoring prioritizes the
underlying infrastructure that supports the web application, including the
browser health, operating system, hardware and network resources. For instance,
metrics like CPU usage, memory utilization and network traffic are collected
and analyzed here for a peek into performance health. More on this in the
subsequent section. Given the additional resource requirements for
micro-frontends, this is another topic where we see variances in our approach
to monitoring for micro-frontends.
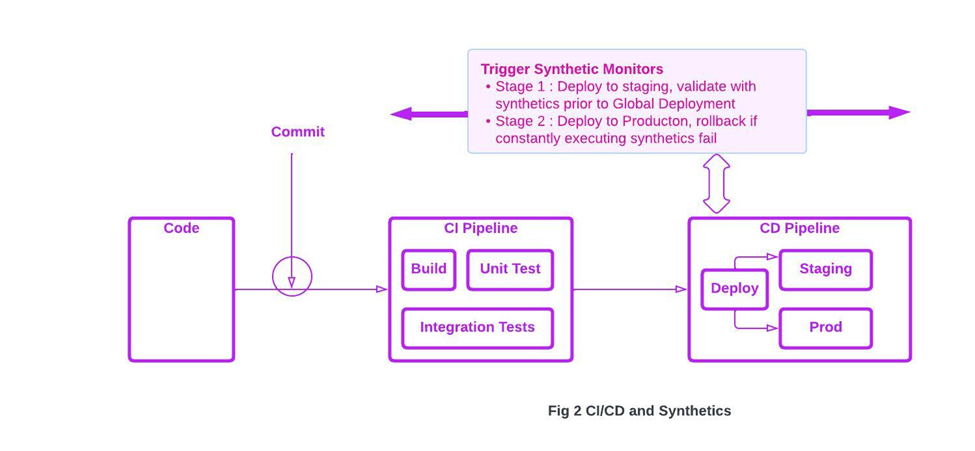
3. Website monitoring
As discussed in the previous section, website monitoring focuses on
accessibility and performance of a web application from the users of the
application perspective. This traditionally involves synthetic monitoring
strategies where we have scripted access to the application executed from
distributed geographic locations. Advanced synthetic testing mimics user
behavior as they engage with the application to determine how it’s working.
3.1. Advantages of Synthetic monitoring
There are some key advantages to maintaining synthetic monitors
- With Synthetic monitoring constantly running, they
can also identify and report issues during low traffic period or during periods
which lack transactions. As an example, in a retail store application, issues
that escalate during night-time deployments often go unnoticed till stores open
in the morning. A synthetic monitor can help catch such issues proactively.
- Synthetic monitoring for user interactions can be
executed based on factors such as geographic location, network types, different
devices and more. This tactic can give proactive insights into application
issues for a specific type of users which may not widespread.
- With synthetic monitors constantly executing, this
tactic also helps create a baseline of application uptime, performance and
availability. Anomaly detection on this data may also help identify emerging
minor issues which may not be full blown outages.
3.2. Types of Synthetic monitoring concerns
Synthetic monitoring can be created to monitor for specific concerns.
The commonly monitored concerns include
- Performance Monitors: This includes scripts that mimic
the user while trying to capture macro page load time as well as micro response
times for specific web assets.
- Availability Monitors: This is the most common pattern
where access to the website determines availability. This pattern can also help
identify other issues that impact availability like connectivity, certs, etc.
There may be complexity involved if website is hidden behind authentication
challenges with specific credentials needed.
- Transaction Monitors: This type of synthetic script looks
at performing an end-to-end transaction. There may be additional monitors to
ensure that the submitted transaction had the desired outcome. As an example, does
an order placed on an ecommerce web-site post successfully to the fulfilment
system, creating an expected entry in the fulfillment database? There is often
complexity around ensuring test data availability for such scenarios. A lot of
applications skip the final submit step owing to complexity or compliance
requirements.
3.3. Granularity of Synthetic monitoring for
web-apps
There may be two levels of granularity for synthetic
- Web Application: these often simulate user
transactions with the webpage.
- API or web resource: These tests access the API or
resource endpoints directly.
3.4. Synthetic monitoring challenges
Synthetic monitoring strategy comes with some common challenges which
are listed below.
- It is often difficult to simulate every possible
transaction scenario within a system. This can prevent application teams from
being able to rely on synthetic monitoring as the only solution.
- Synthetic monitoring can be costly and include
complex setup depending on application type.
- Synthetic tests, especially web application tests
are brittle as UI changes often cause these tests to fail. There are strategies
and learning curve with making the test scripts resilient.
Micro-frontends complicate this strategy in a few ways. Modern micro-frontend
applications are more complex and often distributed. Testing across an entire
micro-frontend application can requires testing individual micro-frontends for
concerns like availability, performance and transaction uptime. This may
complicate the scripting significantly or require additional scripts. If
multiple micro-frontend teams are involved, as is often the case, there is the
added complexity and overhead of managing script creation and co-ordination
across these teams.
4. Application-level monitoring
This type of monitoring also often referred to as ‘End-user-Monitoring’
or ‘Real-user-Monitoring’ looks at the inner workings of the web application. This
type of monitoring looks at capturing logs and health signals while actual
end-users access the application. As such, while it lacks the proactive nature
of synthetic apps, it allows us to quantify user interactions and critical
performance data. This also helps us capture and analyse site metrics like
access by user types, devices etc.
4.1. Advantages of Application-level monitoring
There are some key advantages to maintaining an application monitoring
strategy
- No Test Scope Limitations: Real user monitoring
is not limited by browser, connection types, etc. so can help validate entire
population of the website as well as all use-cases.
- Troubleshooting: This strategy helps us diagnose
and triage issues faced by users. As such, this approach is valued more by
Tier3 teams.
- Actionable Results: Most application monitoring alerts often identify area of the application impacted clearly.
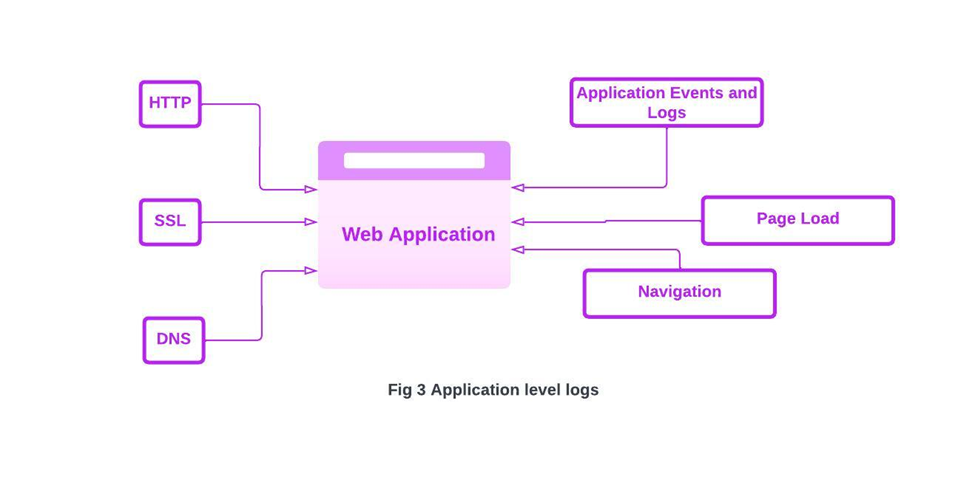
4.2. Application-level monitoring data-points
Application monitoring often uses multiple avenues to capture data.
- Page load events and different measures like first
paint, first contentful paint, time to interactive etc. We can also use this
solution to capture load time breakdown.
- HTTP requests, including RED Metric capture of
rate, error and duration of the API calls going out of the browser. We can also
use this solution to capture load time breakdown and create performance
grouping.
- Static requests load times and insights.
- Browser logs, including capturing different log
levels like warn and log.
- Capturing application sessions and timestamps,
additional application meta-data
- Browser Crash reports.
4.3. Application-level monitoring approaches
The above data can be captured using a combination of a few approaches.
There is always the option of buying a third-party solution to avoid having to
build and maintain a solution.
- Modern browser capabilities and HTML5
specifications, such as the Performance and Navigation Timing APIs, provide
detailed metrics on page load times, resource utilization and user
interactions, enabling fine-grained telemetry. This data can be captured and
persisted outside the application. All modern browsers like Chrome support
advanced observability features through these APIs offering precise
measurements of various performance metrics, including DNS lookup times, TCP
handshake times and document load events.
- Browser logging methods and events can be captured
and persisted. For the logging solution as an example, it is possible to override
the default logging implementation of the browser to capture logs and upload it
server side.
- Application events can often be captured, as an
example, application teams may raise specific events and payloads during
failures which can be captured alongside other health data for triage.
- Server-side RED Capture alongside capturing client-side
data, it is an option to capture data from the nearest API gateway endpoint,
which may help co-relate network issues not visible to application layer.
4.4. Application-level monitoring challenges
While there are advantages to this type of monitoring, it does come
with its set of limitations.
- Noise: This approach can provide
detailed data about every single user session and experience, which can cause
issues. With this large level of detail, it can often cause significant noise
which can either raise false alarms or hide real issues.
- No Baseline: The data captured depends on several
factors including compute on the device, user access patterns, network
connectivity etc. as such, it does not provide the most usable baseline.
- Ineffective during low traffic hours: RUM is not useful if
the website does not have enough traffic, such as late at night for our retail
store example.
- Micro-frontends complicate the application data capture as they cause
even more logs and noise. As previously mentioned, quite a few third-party
solutions have trouble comprehending micro-frontend application data signals
out of box. The same problem applies to homegrown solutions relying on the
modern performance and navigation API(s). The performance object for example
only shows the data for the first loaded micro-frontend which may not be the
main concern we want to monitor.
5. Server (OS) level monitoring
This level of monitoring captures data from the underlying user-agent
or device running the web application. Capturing this level of data is not
always in the hands of the application teams, but this strategy is often
executed alongside synthetic monitoring strategies.
Data points like memory usage, which are a significant concern for
micro-frontends, are often measurable using this strategy. Some modern
browsers, like chrome, allow memory to be captured via the performance object,
a capability that is not widely supported.
6. Conclusion
Observability and telemetry in UI apps come with its own set of
challenges. micro-frontend applications add to this challenge by presenting
unique specificities beyond traditional UI monitoring. By understanding these
specificities and operational requirements and leveraging a combination of synthetics
and application monitoring side by side organizations can still achieve
comprehensive observability for micro-fronted UI Tiers.
References
- https://sematext.com/guides/what-is-real-user-monitoring/-rum-limitations
- https://www.datadoghq.com/product/real-user-monitoring/
- https://www.ibm.com/topics/synthetic-monitoring#:~:text=Synthetic%20monitoring%2C%20or%20synthetic%20testing,and%20impacting%20the%20user%20experience.
- https://www.solarwinds.com/solarwinds-observability/use-cases/web-app-monitoring
- https://medium.com/@NeotericEU/single-page-application-vs-multiple-page-application-2591588efe58
- https://www.buchanan.com/what-is-the-difference-between-it-support-tiers/#:~:text=Your%20Tier%202%20team%20should,the%20product%20engineers%20or%20developers
- https://www.netsuite.com/portal/resource/articles/erp/operational-analytics.shtml
- https://onlinedegrees.scu.edu/media/blog/data-analytics-driving-better-business-decisions#:~:text=The%20four%20subsets%20of%20data,at%20all%20levels%20of%20operations
- https://newrelic.com/blog/best-practices/what-is-observability
- https://en.wikipedia.org/wiki/Real_user_monitoring
- https://www.swyx.io/frontend-observability