Research Article
Unified Monitoring for Microservices: Implementing Prometheus and Grafana for Scalable Solutions
Abstract
Monitoring is crucial for the effective management of microservices architectures. This paper explores the implementation of Prometheus and Grafana, two powerful open-source tools, for scalable monitoring solutions. It discusses these tools' benefits, setup, and integration to provide a unified monitoring framework. Additionally, the paper examines the importance of error monitoring in microservices, the significance of variables in monitoring configurations, and the implementation of alerts in Grafana1.
1. Introduction
Microservices architecture has become the standard for building large-scale, distributed applications. This approach decomposes applications into loosely coupled services, each responsible for a specific functionality. While microservices offer numerous advantages, such as improved scalability and easier maintenance, they also introduce significant monitoring challenges due to their dynamic and distributed nature2.
Effective monitoring is essential to ensure microservices' reliability, performance, and health. Traditional monitoring tools often fall short in handling the complexities of microservices. Prometheus and Grafana have emerged as leading tools in the realm of microservices monitoring, providing scalable and flexible solutions3.
2. Microservices Architecture and Monitoring Needs
Microservices architecture involves breaking down applications into smaller, independent services that communicate over networks4. This approach enhances flexibility and scalability but complicates monitoring. Key challenges include:
• Dynamic Nature: Services can be created or terminated frequently, requiring dynamic monitoring solutions5.
• Distributed Systems: Microservices run across multiple servers or clusters, necessitating centralized monitoring6.
• Scalability: The monitoring solution must handle the increased load without degrading performance7.
Effective monitoring in microservices should provide insights into the health, performance, and behavior of individual services and the system. This includes tracking metrics, logging, and tracing requests.
3. Prometheus: An Overview
Prometheus is an open-source monitoring and alertingm toolkit designed specifically for reliability and scalability. Key features of Prometheus include:
• Data Collection and Storage: Prometheus scrapes metrics from instrumented services and stores them in a time-series database8.
• Time-Series Database: Optimized for storing and querying time-series data.
• Alerting System: Allows defining alerting rules and notifying users when conditions are met.
3.1. Advantages of Prometheus:
• Scalability: Handles large volumes of data efficiently.
• Flexibility: Supports a wide range of metrics and custom queries.
• Integration Capabilities: Integrates with various data sources and systems.
4. Implementing Prometheus for Microservices Monitoring
1. Setting up Prometheus:
• Installation and Configuration: Install Prometheus on a server or container. Configure prometheus.yml for service discovery and scraping endpoints.
• Service Discovery: Automatically discovers services using static configurations, DNS, or service discovery mechanisms like Kubernetes.
2. Instrumenting Microservices
• Metrics Exposition: Expose metrics from services using Prometheus client libraries available for various programming languages.
• Client Libraries: Use libraries to define and expose custom metrics, such as request duration, error rates, and resource usage.
3. Creating and Managing Alerts
• Alert Rules: Define rules to trigger alerts based on metric thresholds.
• Alertmanager Setup: Configure Alertmanager to handle alerts, route them, and send notifications via email, Slack, or other channels.
5. Types of Metrics and Prometheus Queries
Prometheus allows querying various metrics to monitor microservices' health and performance. Here are some common types of metrics and example queries:
1. Counter Metrics
Counters are metrics that only increase. They are useful for counting occurrences of events9.
● Total HTTP Requests:

● Total Errors:

2. Gauge Metrics: Gauges are metrics that can go up and down. They are useful for measuring current values like temperature, memory usage, etc10.
● Current Memory Usage:

● Current CPU Usage:

3. Histogram Metrics
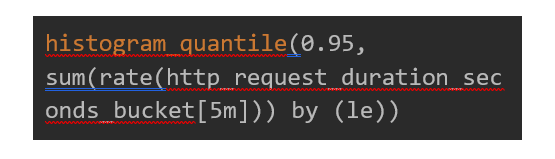
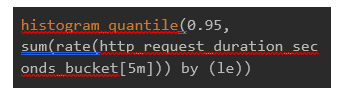
Histograms measure the distribution of events. They are useful for tracking latencies and request durations11 .
● Request Duration
4. Summary Metrics
Summaries provide a statistical summary of observed values, like histograms, but also calculate configurable quantiles11.
● Request Latency:

● Custom Metrics: Custom metrics are defined by the application and can be tailored to specific needs.
5.1. Application-Specific Metric (e.g., Active Users)

● Resource Utilization Metrics: Monitoring resource utilization helps ensure that the infrastructure is adequately provisioned.

● CPU Utilization:

1. Latency and Timeout Errors: Monitoring latency and timeout errors can help diagnose network or performance-related issues.
● High Latency Detection:
● Timeout Errors:

● Memory Utilization:

2. Dependency Errors: Microservices often depend on other services or external systems. Monitoring these dependencies is crucial.
3. Dependency Failure Rate:

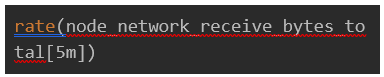
4. Network Metrics
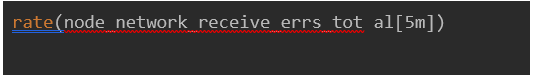
Monitoring network traffic and errors ensures reliable communication between microservices.
● Network Traffic:
● Network Errors:
6. Error Monitoring in Microservices
Error monitoring is a critical aspect of maintaining a healthy microservices architecture. Identifying and resolving errors promptly ensures the reliability and performance of services12.
1. Error Rate Metrics: Tracking the rate of errors across services helps in identifying problematic areas.
● Total Error Rate:

● Error Rate by Service:
● Database Error Rate:

2. Logs and Traces: Integrating log and trace data with metrics can provide a more comprehensive view of errors.
● Log Monitoring: Use centralized logging solutions like ELK Stack (Elasticsearch, Logstash, Kibana) to aggregate and analyze logs for error patterns.
● Distributed Tracing: Tools like Jaeger or Zipkin can trace service requests to pinpoint where errors occur.
7. Grafana: An Overview
Grafana is an open-source platform for monitoring and observability. It provides powerful visualization capabilities and integrates seamlessly with Prometheus.
1. Key Features of Grafana:
● Data Visualization: Offers a wide range of visualization options, including graphs, heatmaps, and gauges.
● Dashboard Creation: Allows creating and sharing customizable dashboards.
● Integration with Prometheus: Supports Prometheus as a data source for real-time visualization of metrics.
2. Advantages of Grafana:
● Customizable Dashboards: Tailor dashboards to specific monitoring needs.
● Rich Visualization Options: Choose from various visualizations to represent data effectively.
● User-Friendly Interface: Intuitive UI for creating and managing dashboards.
8. Implementing Grafana for Microservices Monitoring
1. Setting Up Grafana:
● Installation and Configuration: Install Grafana on a server or container. Configure it to connect to Prometheus as a data source.
● Data Source Configuration: Add Prometheus as a data source in Grafana settings.
2. Creating Dashboards:
● Key Metrics to Monitor: Identify crucial metrics such as CPU usage, memory consumption, request rates, error rates, and latency.
● Visualization Best Practices: Use appropriate visualizations to represent data clearly and effectively.
3. Advanced Features and Plugins:
● Annotations: Mark events on graphs for correlation with metric spikes or anomalies.
● Custom Plugins: Extend Grafana's capabilities with plugins for additional data sources and visualizations.
9. Importance of Variables in Monitoring Configurations
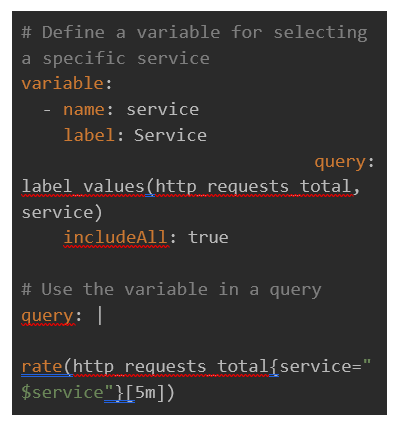
Variables play a crucial role in monitoring configurations, offering flexibility and dynamism in how data is displayed and managed. In Grafana, variables allow for creating more dynamic and reusable dashboards [13].
● Enhanced Flexibility: Variables can be used to change the data displayed on dashboards dynamically. You can switch between different services, environments or metrics without creating separate dashboards for each context.
● Improved Reusability: With variables, a single dashboard can serve multiple purposes. For example, you can create a dashboard template and use variables to filter data based on criteria like service name, instance, or region.
● Simplified Maintenance: Using variables reduces the need to duplicate dashboards for slight variations in data. This simplifies maintenance, as updates need to be made in one place rather than across multiple dashboards.
● User Interaction: Variables provide an interactive experience for users, allowing them to select values from dropdowns, which can change the displayed data without needing multiple static dashboards.
Example of Variables in Grafana
Alerts in Grafana

Alerts are critical for proactive monitoring, enabling timely responses to issues before they escalate. Grafana provides robust alerting capabilities that work in conjunction with Prometheus.
1. Define an Alert Condition:
Navigate to the desired panel and click on the "Alert" tab. Set the conditions for the alert using Prometheus query language (PromQL).
Example condition: Trigger an alert if the error rate exceeds a threshold. response to issues, minimizing downtime and maintaining system reliability.
Example of Alert Configuration in Grafana:

2. Configure Alert Details:
Define the evaluation interval, which determines how often the condition is checked. Set up notifications to specify how alerts should be delivered (e.g., email, Slack, PagerDuty).
1. Notification Channels: Grafana supports multiple notification channels for sending alerts. You can configure these channels to ensure alerts reach the right people promptly.
2. Email Notifications:
● Configure SMTP settings in Grafana.
● Add an email address as a notification channel.
3. Slack Notifications:
● Set up a Slack incoming webhook.
● Add the webhook URL as a notification channel in Grafana.
4. PagerDuty Notifications:
● Configure a PagerDuty service and integration.
● Add the integration key as a notification channel in Grafana.
3. Alert evaluation and handling
Alerts are evaluated based on the defined conditions and intervals. When an alert is triggered, Grafana sends notifications to the configured channels. This enables rapid.
10. Conclusion
Unified monitoring is not just a best practice, it's a necessity for managing the complexity of microservices architectures. Prometheus and Grafana provide a powerful, scalable, and flexible solution for monitoring microservices. Organizations can gain deep insights into their systems by implementing these tools, ensuring reliability and performance. Integrating Prometheus' robust data collection and alerting with Grafana's rich visualization capabilities offers a comprehensive monitoring solution suitable for modern microservices environments. Additionally, incorporating effective error monitoring is essential for maintaining the health and performance of microservices. Organizations can quickly identify and resolve issues by tracking error rates, latency issues, and dependency failures, ensuring a robust and resilient microservices architecture. The importance of variables in monitoring configurations cannot be overstated. They enhance flexibility, improve reusability, simplify maintenance, and provide an interactive user experience, making Grafana dashboards more dynamic and adaptable to various monitoring needs. to respond swiftly to potential issues. By setting up effective alerts and notification channels, teams can ensure they are promptly informed of any problems, enabling them to take corrective actions before those issues impact users or services.
11. References
- Göktürk M, Kazdal I, Biskinler AF. Jindo: Smart Microservice Monitoring and Development Tool. Int J Compu App 2021.
- Dragoni N, Giallorenzo S, Lafuente AL, et al. Microservices: Yesterday, today, and tomorrow. Present and Ulterior Software Engineering 2017.
- Heinrich R, van Hoorn A, Knoche H, et al. Performance Engineering for Microservices: Research Challenges and Directions. ICPE '17 Companion: Proceedings of the 8th ACM/SPEC on International Conference on Performance Engineering Companion 2017.
- Shabani I. Mëziu E, Berisha B. Design of Modern Distributed Systems based on Microservices Architecture. Int J Adv Comp Sci App 2021;12.
- Burns B, Oppenheimer D. Design patterns for container-based distributed systems. The 8th Usenix Workshop on Hot Topics in Cloud Computing (HotCloud '16) 2016.
- Kufel L. Tools for Distributed Systems Monitoring. Foundations of Computing and Decision Science 2016;41.
- Prometheus.
- Metrictypes .
- Prometheus Blog Series (Part 2): Metric types.
- Gregg B. Visualizing system latency. ACM 2010.
- Jiang Y, Zhang N, Ren Z. Research on Intelligent Monitoring Scheme for Microservice Application Systems. 2020 International Conference on Intelligent Transportation, Big Data & Smart City (ICITBS) 2020.
- Grafana documentation.